
Swampscott 2019 Housing Market Summary
[Click Swampscott 2019 to download a copy of this report.]
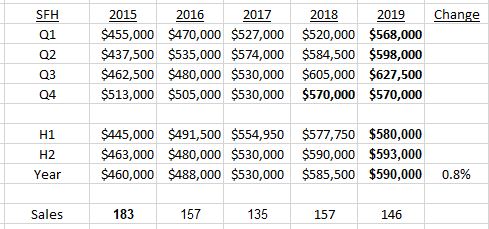
Single Family Homes
After three years of strong growth the median price of the SFHs sold in 2019 increased less than 1%. Sales remained well below the peak level of 2015.
Condos
The median price of the condos sold dropped 2.5% to $345,000. Excluding sales at the Avery development in both years the median price increased $4,000.
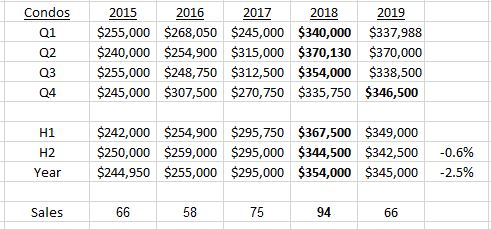
NB Numbers in bold represent record levels. Sources: MLSPIN, OliverReports.com
Andrew Oliver
Market Analyst | Team Harborside | teamharborside.com
REALTOR®
Sagan Harborside Sotheby’s International Realty
One Essex Street | Marblehead, MA 01945
m 617.834.8205
www.OliverReports.com
Andrew.Oliver@SothebysRealty.com
Sotheby’s International Realty® is a registered trademark licensed to Sotheby’s International Realty Affiliates LLC. Each Office Is Independently Owned and Operated
Open Houses weekend January 11/12
A strange January weekend: the Pats aren’t playing and the temperature will be 60 degrees.
Here are the Open Houses. Check back tomorrow at 8 a.m. for an updated list for Sunday.

Click on these links for details:
Marblehead Open Houses
Swampscott Open Houses
Salem Open Houses
Beverly Open Houses
Lynn Open Houses
and click Open Houses to check other Massachusetts towns.
Andrew Oliver
Market Analyst | Team Harborside | teamharborside.com
REALTOR®
Sagan Harborside Sotheby’s International Realty
One Essex Street | Marblehead, MA 01945
m 617.834.8205
www.OliverReports.com
www.TeamHarborside.com
Andrew.Oliver@SothebysRealty.com
Sotheby’s International Realty® is a registered trademark licensed to Sotheby’s International Realty Affiliates LLC. Each Office Is Independently Owned and Operated
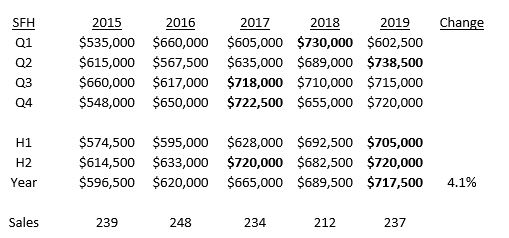
Marblehead 2019 Housing Market Summary
[Click Marblehead 2019 report to download a copy of this report.]
Single Family Homes (SFH)
The median price increased 4.1%, breaking $700,000 for the first time. Sales recovered from last year’s dip and were in line with the average of recent years.
Condos
The median price increased 7.8% to just under $400,000, while sales were in line with the average of recent years.
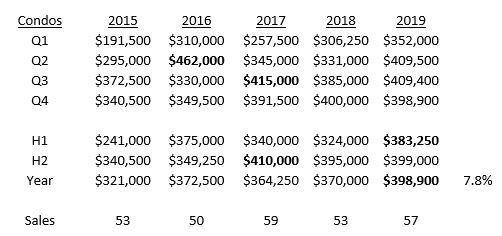
NB Numbers in bold represent record levels. Sources: MLSPIN, OliverReports.com
Andrew Oliver
Market Analyst | Team Harborside | teamharborside.com
REALTOR®
Sagan Harborside Sotheby’s International Realty
One Essex Street | Marblehead, MA 01945
m 617.834.8205
www.OliverReports.com
Andrew.Oliver@SothebysRealty.com
Sotheby’s International Realty® is a registered trademark licensed to Sotheby’s International Realty Affiliates LLC. Each Office Is Independently Owned and Operated
New Listings week ending January 10
New Listings are starting to trickle in:

Marblehead New Listings
Swampscott New Listings
Salem New Listings
Beverly New Listings
Lynn New Listings
and click Other Towns to search a Massachusetts town not shown above.
Andrew Oliver
Market Analyst | Team Harborside | teamharborside.com
REALTOR®
Sagan Harborside Sotheby’s International Realty
One Essex Street | Marblehead, MA 01945
m 617.834.8205
www.OliverReports.com
www.TeamHarborside.com
Andrew.Oliver@SothebysRealty.com
Sotheby’s International Realty® is a registered trademark licensed to Sotheby’s International Realty Affiliates LLC. Each Office Is Independently Owned and Operated
New Listings mid-week January 8
Here are the latest New Listings:

Click on the links below for details:
Marblehead New Listings
Swampscott New Listings
Salem New Listings
Beverly New Listings
Lynn New Listings
and click Search to check New Listings in other towns in Massachusetts.
Andrew Oliver
Market Analyst | Team Harborside | teamharborside.com
REALTOR®
Sagan Harborside Sotheby’s International Realty
One Essex Street | Marblehead, MA 01945
m 617.834.8205
www.OliverReports.com
www.TeamHarborside.com
Andrew.Oliver@SothebysRealty.com
Sotheby’s International Realty® is a registered trademark licensed to Sotheby’s International Realty Affiliates LLC. Each Office Is Independently Owned and Operated
Essex County 2020 Commercial property tax rates: Town by Town guide
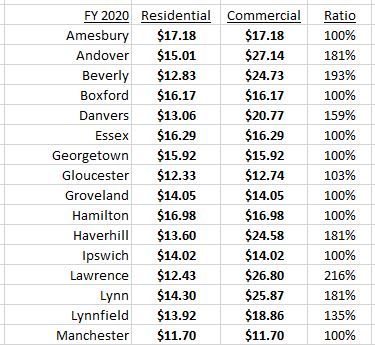
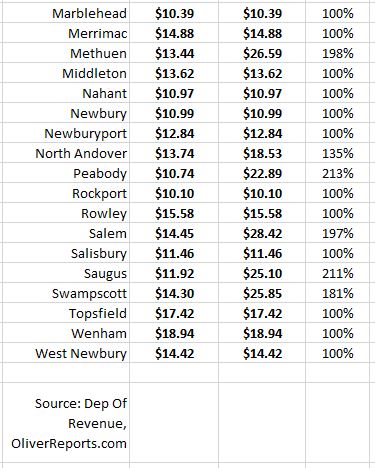
While most of us look at residential tax rates, fewer are concerned with commercial tax rates. Yet a healthy commercial business environment can contribute significantly to the attractiveness of a town. The map below shows commercial rates in each of Essex County’s 34 cities and towns, followed by a table comparing residential and commercial rates.
(Click here to download a copy of this map and here to download the table)
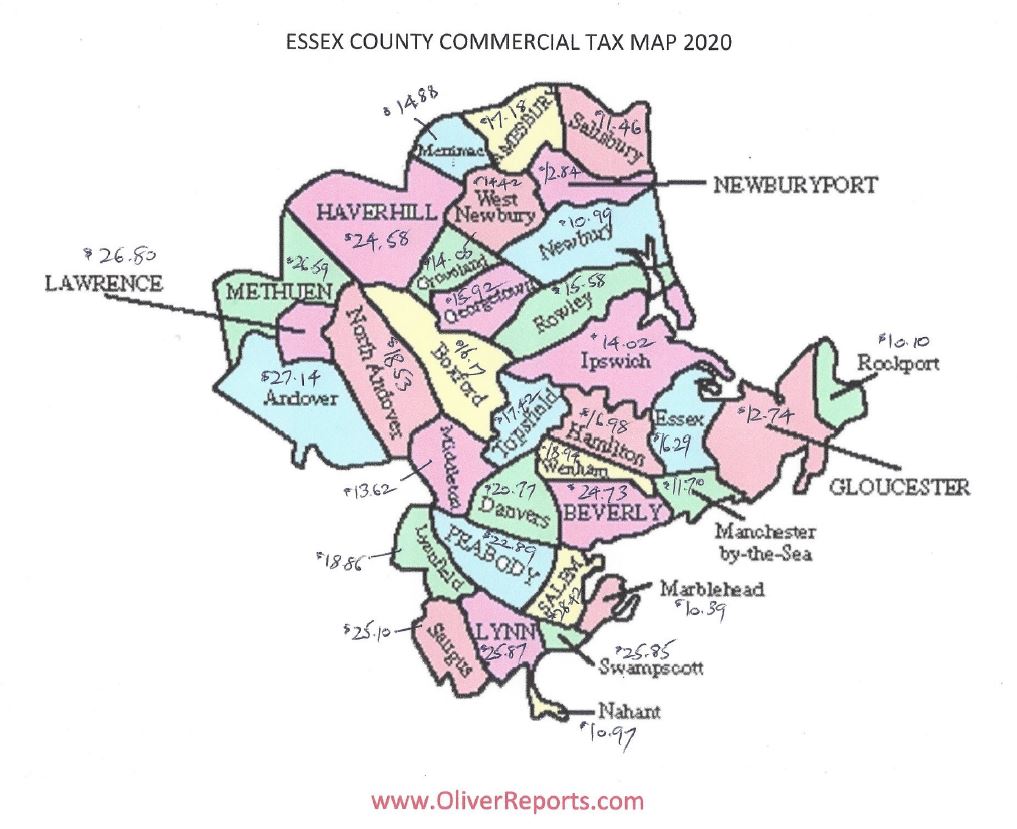
There is a bigger variation in commercial rates than in residential rates
The lowest rate for both residential and commercial rates is Rockport’s $10.10, but while the highest residential rate is Wenham’s $18.94, there are 11 towns with commercial rates over $20, with the highest being $28.42 in Salem. 20 towns set the same rate for both residential and commercial, while in 3 towns the commercial rate is more than double the residential one.
Why do some towns have different residential and commercial tax rates?
Cities and towns have the ability to increase the percentage of the total tax bill paid by commercial (and industrial and personal) property owners. The percentage of the value of property classified as commercial varies enormously from town to town.
In Marblehead, for example, where residential property is 95% of the total, a 50% tax shift to commercial would increase the average commercial tax bill from $7,003 to $10,508, while reducing the average residential tax bill by only $189.
Towns with a higher percentage of commercial property are more likely to shift an increased share of the tax bill to commercial owners.
Andrew Oliver
Market Analyst | Team Harborside | teamharborside.com
REALTOR®
Sagan Harborside Sotheby’s International Realty
One Essex Street | Marblehead, MA 01945
m 617.834.8205
www.OliverReports.com
www.TeamHarborside.com
Andrew.Oliver@SothebysRealty.com
Sotheby’s International Realty® is a registered trademark licensed to Sotheby’s International Realty Affiliates LLC. Each Office Is Independently Owned and Operated
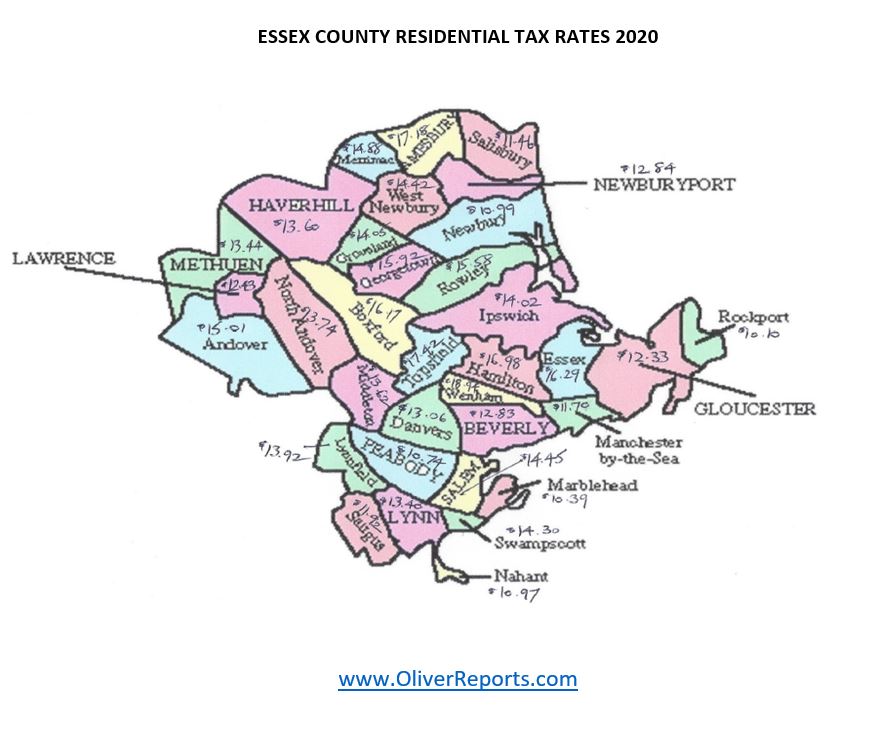
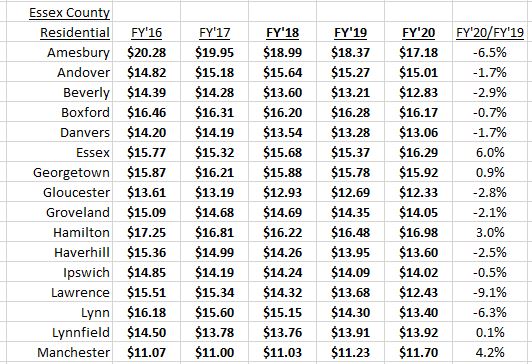
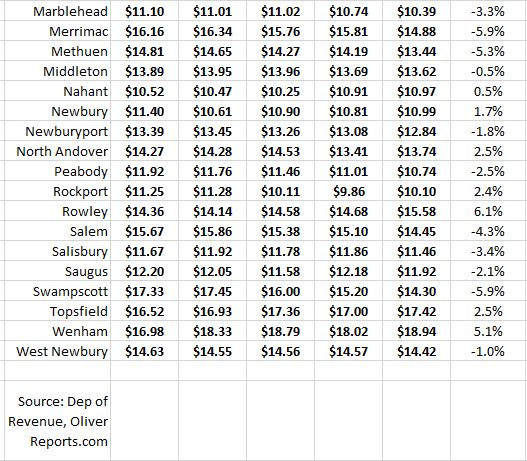
Essex County 2020 property tax rates: a Town by Town guide
Property tax rates for FY 2020 for all 34 cities and towns in Essex County have been announced. Below is a map (which you can download by clicking here), so that you can compare tax rates in neighboring towns, followed by the tax rates for each town the last five years. The first table shows the tax rates in alphabetical order, while the second lists them from low to high.
Tax rates for each town
Alphabetically (download a copy of this table by clicking here.
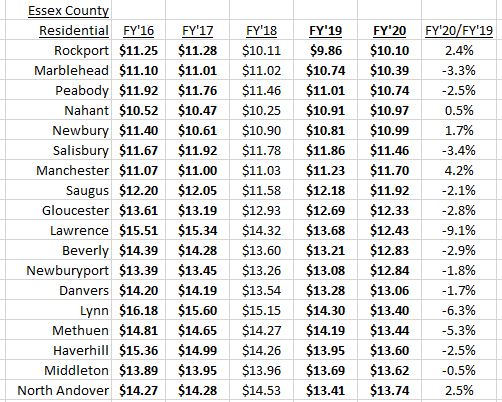
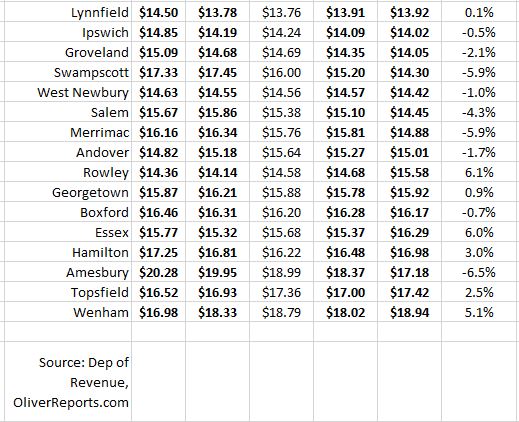
From lowest to highest based on 2020 rates (download a copy of this table by clicking here)
Median and Average Tax Rates
The median tax rate for 2020 is $13.68, down from $14.02 in 2018, while the average tax rate has dropped from $13.95 to $13.80. The highest taxed town, Wenham, has a rate 38% higher than the County median, while the lowest, Rockport, is 26% below the median. Or put another way, the highest tax rate in Essex County is 88% higher than the lowest.
How property tax rates are calculated
There are two main points to understand:
The dollar amount raised by property taxes is based on a simple formula: the dollar levy for the previous year plus 2 1/2% (Prop 2 1/2), plus any new growth (e.g. new construction), plus debt service.
The tax rate is then calculated by dividing the dollar amount to be raised by the Assessed Value of all property. For FY 2020 (July 2019-June 2020) Assessed Values are based upon sales during 2018. Sales in 2019 will be used for calculating the FY 2021 tax rates.
20 of Essex County’s cities and towns choose a single tax rate, whereby residential and commercial properties are taxed at the same rate. The other 14 cities and towns choose a split tax rate whereby commercial properties are taxed at a higher rate – in some cases a much higher rate.
A separate report on commercial tax rates can be read by clicking here.
For a walk through the tax calculation read How is Marblehead’s 2020 Tax Rate calculated?
Tax rate changes in 2020
Of the 34 cities and towns in Essex County, 22 have announced decreases in their 2020 residential tax rate while 12 have had increases approved. Decreases of 5% or more were seen in Lawrence, Amesbury, Lynn, Swampscott, Merrimac and Methuen, while 5% or larger increases were recorded in Wenham, Essex and Rowley. Bear in mind that a major determinant of the change in tax rates is the movement in Assessed Values. Thus, in a time of rising home prices, a general expectation is that tax rates should be flat to down.
Tax Rates of Neighboring Towns
Where taxes become interesting is when one can compare tax rates in neighboring towns. Many people, especially those moving to the area, whether from Boston or elsewhere, are willing to consider more than one town.There are many factors in the decision about where to live, but tax rates can be a significant influence on the decision, and may become more so with the new limitation on the deduction of property taxes from Federal taxation. Some argue that lower property values offset higher taxes. Frequently, however, residents of highly taxed towns cite taxes as a reason for wanting to move.
Andrew Oliver
Market Analyst | Team Harborside | teamharborside.com
REALTOR®
Sagan Harborside Sotheby’s International Realty
One Essex Street | Marblehead, MA 01945
m 617.834.8205
www.OliverReports.com
www.TeamHarborside.com
Andrew.Oliver@SothebysRealty.com
Sotheby’s International Realty® is a registered trademark licensed to Sotheby’s International Realty Affiliates LLC. Each Office Is Independently Owned and Operated
Open Houses Sunday January 5
No Super Bowl this year. Perhaps one of these properties will make up for the disappointment:

Marblehead Open Houses
Swampscott Open Houses
Salem Open Houses
Beverly Open Houses
Lynn Open Houses
and click Other Towns to search towns not shown above.
Andrew Oliver
Market Analyst | Team Harborside | teamharborside.com
REALTOR®
Sagan Harborside Sotheby’s International Realty
One Essex Street | Marblehead, MA 01945
m 617.834.8205
www.OliverReports.com
www.TeamHarborside.com
Andrew.Oliver@SothebysRealty.com
Sotheby’s International Realty® is a registered trademark licensed to Sotheby’s International Realty Affiliates LLC. Each Office Is Independently Owned and Operated
Open Houses weekend January 4/5
A small number of Open Houses the first weekend of the year. Check tomorrow at 8 a.m. for an updated list for Sunday.

Marblehead Open Houses
Swampscott Open Houses
Salem Open Houses
Beverly Open Houses
Lynn Open Houses
and click Other Towns to search towns not shown above.
Andrew Oliver
Market Analyst | Team Harborside | teamharborside.com
REALTOR®
Sagan Harborside Sotheby’s International Realty
One Essex Street | Marblehead, MA 01945
m 617.834.8205
www.OliverReports.com
www.TeamHarborside.com
Andrew.Oliver@SothebysRealty.com
Sotheby’s International Realty® is a registered trademark licensed to Sotheby’s International Realty Affiliates LLC. Each Office Is Independently Owned and Operated
New Listings at the start of the New Year
A tiny number of New Listings at the start of the year contributing to the small number of properties available for sale:

Marblehead New Listing
Swampscott New Listing
Salem New Listings
Beverly New Listings
Lynn New Listings
Andrew Oliver
Market Analyst | Team Harborside | teamharborside.com
REALTOR®
Sagan Harborside Sotheby’s International Realty
One Essex Street | Marblehead, MA 01945
m 617.834.8205
www.OliverReports.com
www.TeamHarborside.com
Andrew.Oliver@SothebysRealty.com
Sotheby’s International Realty® is a registered trademark licensed to Sotheby’s International Realty Affiliates LLC. Each Office Is Independently Owned and Operated
Housing Inventory slumps further
Single Family Homes (SFH)
After years of decline, the number of Single Family Homes (SFH) for sale in Essex County on the first of the month compared with a year earlier (YOY) increased from August 2018 until June 2019. Since then the decline has resumed and, in fact, accelerated, as this table shows:
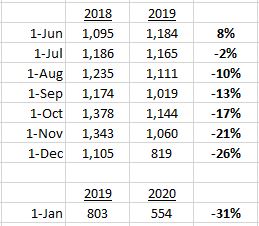
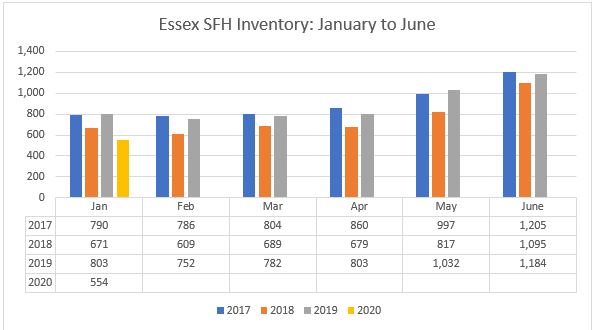
The next two charts (the first for January to June; the second July to December) show the number of SFHs for sale on the first of the month since 2017. In the first chart the number for January 2020 -554 – shows the renewed decline (in 2019 inventory was increasing until June).
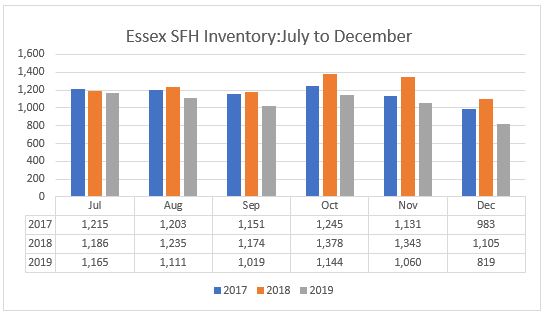
The second chart shows the decline YOY each month from July to December in 2019.
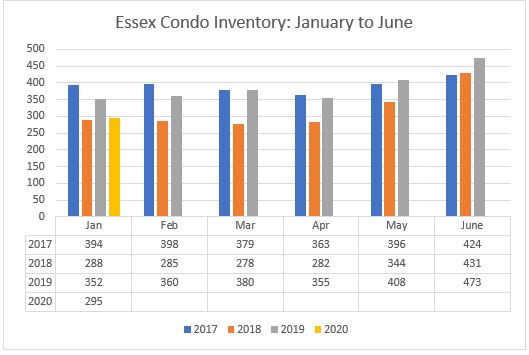
Condos
The number of condos for sale increased YOY from June 2018 until August 2019, but since then there has been a decline, which has also accelerated, although it moderated slightly in January.
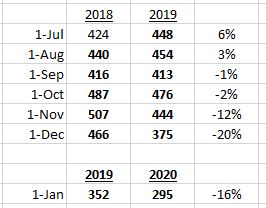
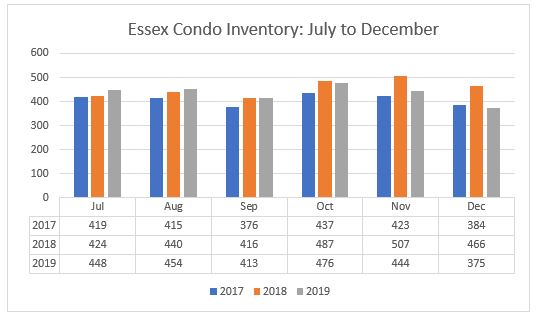
These two charts show numbers since 2017 for January to June, and July to December.
The first chart shows the decline in January 2020 YOY while in 2019 inventory was increasing in the first 6 months of the year.
The second chart shows inventory continuing to increase in 2019 YOY in July and August, steadying in September, and then resuming the decline in October.
Comment
While the overall supply of SFHs in Essex County remains very low at just 1 month ( a market is considered to be in equilibrium between buyers and sellers when there is 6 months of supply) the position varies greatly by price, as shown in this table:
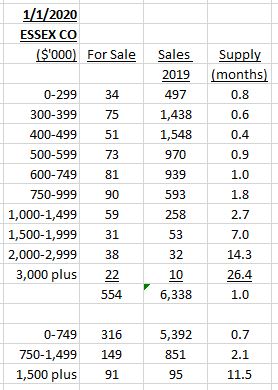
Also bear in mind that the January inventory is always the lowest for the year so while the position is dire, it may not be quite a dire as these numbers suggest.
Nevertheless, the conclusion remains that the market remains in favour of sellers right up to $1.5 million, but above that dramatically swings in favour of buyers.
Andrew Oliver
Market Analyst | Team Harborside | teamharborside.com
REALTOR®
Sagan Harborside Sotheby’s International Realty
One Essex Street | Marblehead, MA 01945
m 617.834.8205
Recent Comments