
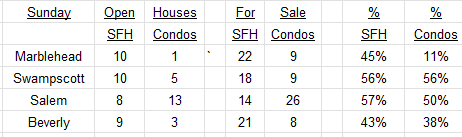
Open Houses weekend June 11/12
Here are this weekend’s Open Houses (an updated list will be published tomorrow at 8 a.m.): (more…)
How far Behind the Curve is the Federal Reserve?
In March 2020, as the impact of COVID-19 was being felt, the Federal Reserve cut the Fed Funds rate by 50 basis points ( 0.5%) on March 3 and followed that with a 100 basis points (1%) cut on March 15th – a total of 1.5% in under two weeks. This emergency action was decisive and instrumental in preventing a financial disaster. But the economy quickly bounced back with a huge rebound in Q3 2020. The emergency was over.
The Fed, however, kept pumping huge amounts of cash into the economy. Eventually, the market decided that the Fed was behind the curve and market rates took off. Yet the Fed has been slow – make that very slow – to respond. This chart shows interest rates on January 31st 2020, the trading day before COVID-19 was declared to be a public health emergency in the US, and this Friday after the announcement that the Consumer Price Index rose 8.6% in May from a year earlier.
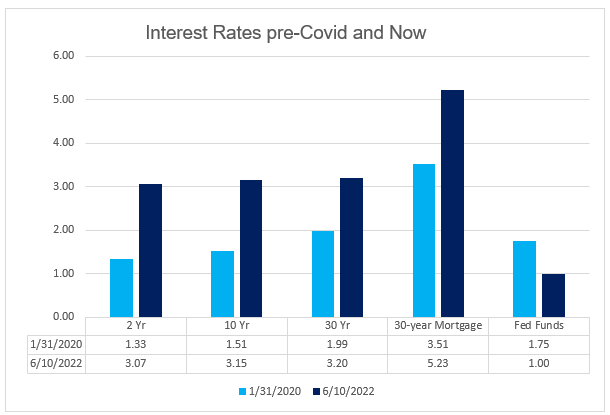
Does anything strike you about this chart? Such as the fact that all the market interest rates are up anywhere from 50% to 130% – and the Fed Funds rate is still way down from its pre-COVID level. (more…)
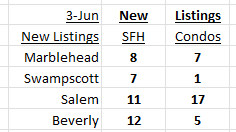
New Listings week ending June 10
A good number of New Listings again this week:
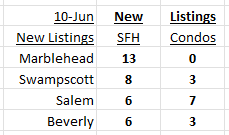
Click on these links for details: (more…)
Have Home Sales slowed?
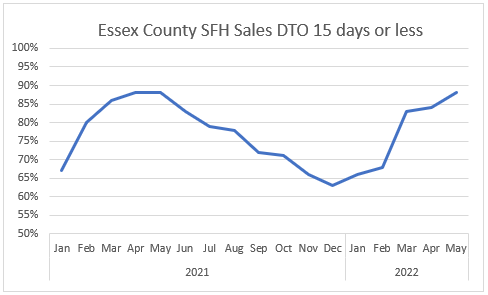
Last week I published How quickly are houses selling? which showed that 88% of sales which closed in May received offers in 15 days or fewer.
But home sales are a lagging indicator, with May reported sales reflecting contracts agreed to for the most part in March. At the onset of COVID I started tracking the number of offers accepted on a weekly basis. This showed a sharp drop from mid-March 2020 which lasted only until early May, after which the number of accepted offers took off.
With all the publicity about the sharp jump in mortgage rates, the high level of inflation, concerns about a possible recession, etc. etc. one might have accepted to see a slow down in the number of accepted offers. This chart shows the weekly numbers YTD for 2021 and 2022: (more…)
New Listings mid-week June 8
A good number of New Listings again this week:
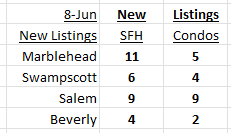
Click on these links for details: (more…)
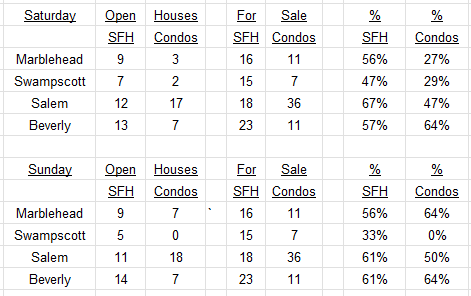
Marblehead Facts and Figures Weekly Update
|


How quickly are houses selling?
The following chart shows the percentage of sales each month where the offer was received in 15 days or less after listing:
Comment
Sales are a lagging indicator – May sales, for example, for the most part reflect sales agreed in March – but they do demonstrate the strength of demand – and the seasonality of the market in New England. I shall publish an article tomorrow showing the number of Accepted Offers week by week to show the level of current activity. (more…)
New Listings week ending June 3
We have seen a good flow of New Listings this week:
Click on these links for details: (more…)
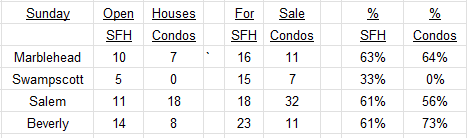
Open Houses June 4/5
Here are this weekend’s Open Houses (an updated list will be published tomorrow at 8 a.m.):
Click on these links for details: (more…)
New Listings mid-week June 1
Here are the latest New Listings:

Click on these links for details: (more…)
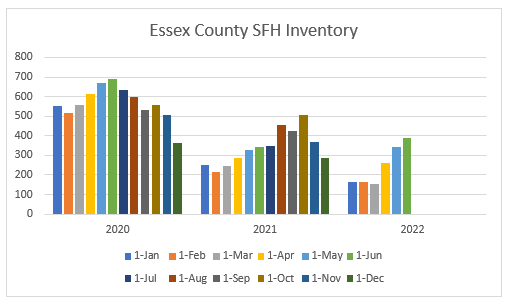
June Housing Inventory: still way below 2020 levels
There has been a sharp increase in the number of properties for sale in the last three months, but while this takes inventory of SFHs above the year ago level, it remains well below that of 2020:
Single Family Homes
Condos
The number of Condos available has also jumped, but in this case still remains below year ago levels:
Recent Comments