
SWAMPSCOTT 2023 MARKET REPORT and 5-YEAR REVIEW
Swampscott’s focus on controlling its expenditures and hence the property tax rate has brought increased buyer interest in recent years, with two-thirds of all sales in 2023 being at or above list price.
As elsewhere, the shortage of inventory was a major factor in both price increases and the speed of sales in 2023, despite the more than doubling of mortgage rates.
Fluctuations in median prices can and do occur from quarter to quarter, based upon those properties which actually sell, which is why the trend is more important than the exact numbers. Go HERE to download a copy of this report.
If you are thinking of selling, please contact me for a current market analysis for your property.
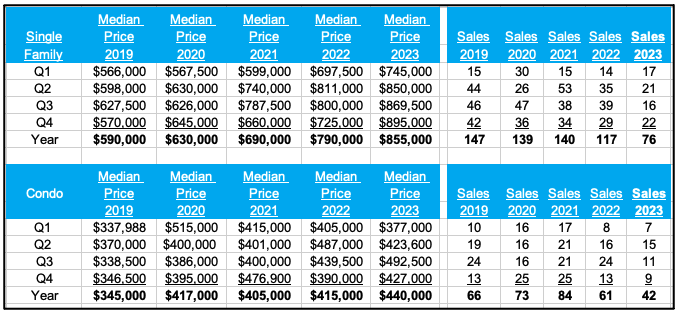
Median Price and Sales
The median price of the Single Family homes sold in Swampscott increased 45% from $590,000 in 2019 to $855,000 in 2023. Sales were steady from 2019 to 2021, but dropped in 2022, and again, sharply, in 2023.
The median price of the Condos sold increased by 28% from $345,000 in 2019 to $440,000 in 2023, with sales following a similar pattern to that for SFHs.
 (more…)
SWAMPSCOTT Q3 MARKET REPORT 2019-2023
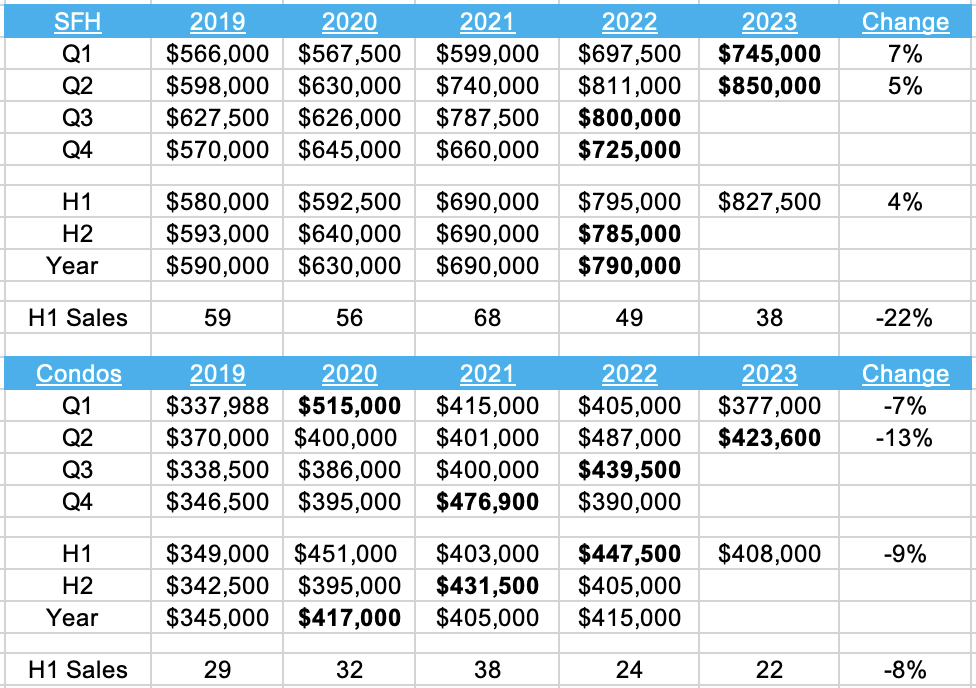
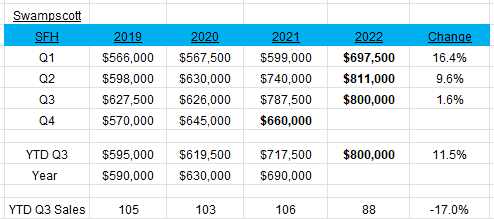
Median Price and Sales
The median price of the Single Family homes sold in Swampscott increased 34% from $590,000 in 2019 to $790,000 in 2022, and further to $840,000 through Q3 2023. Sales were steady from 2019 to 2021, but dropped in 2022, and again YTD in 2023.
The median price of the Condos sold increased by 20% from $345,000 in 2019 to $415,000 in 2022, and to $440,000 through Q3 2023, with sales following a similar pattern to that for SFs.
Swampscott’s focus on controlling its expenditures and hence the property tax rate has brought increased buyer interest in recent years, with two-thirds of all sales this year being at or above list price.
Just as in prior periods of housing market strength, the market in Swampscott saw a steady – rather than spectacular – increase in prices during the boom days of asset price increases which were fueled by cheap credit, during and after the pandemic.
The more than doubling of mortgage rates has also been a major factor in encouraging people to stay in their existing homes, further reducing the supply of homes for sale.
Finally, fluctuations in median prices can and do occur when the numbers are small, which is why the trend is more important than the exact numbers.
If you are thinking of selling, please contact me for a current market analysis for your property.
Go HERE to download a copy of the full report.
This report analyses the Median Price and Sales per quarter since 2019, along with the Sales by Price point, Price per Sq.Ft., and the Days properties were on the market before receiving an offer (DTO).
Median numbers are used in all calculations.
And read these recent articles:
Most Sales Still Over List Price
Core Inflation Prices Barely Budged in August
October Inventory shows Sharp Jump from September</a.
Credit Score Change Could Help Millions of Buyers
August Sales still mostly over List Price
2023 Sales Continue Strongly over List Price (more…)
August Sales still mostly over List Price
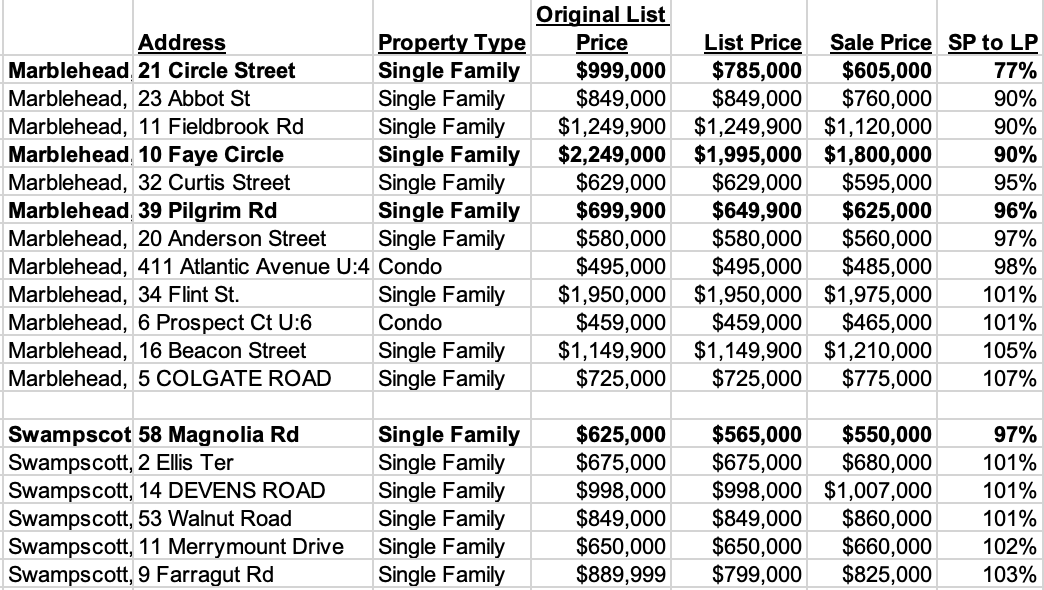
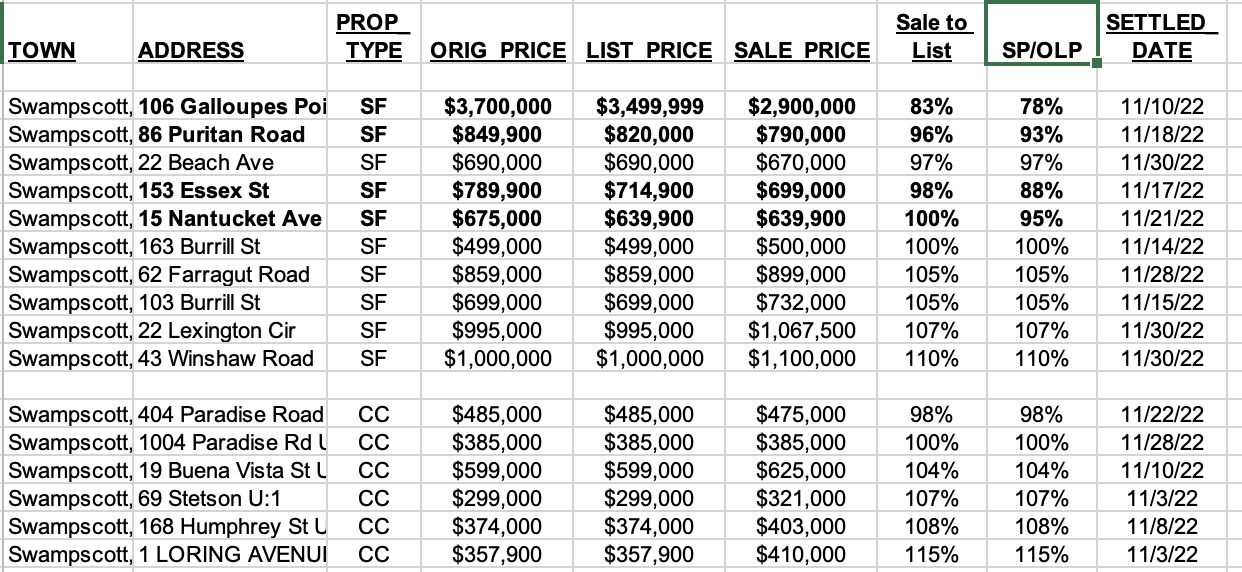
In August 60% of sales in Marblehead, 70% of Swampscott sales and 68% of Salem sales, were over List Price.
Marblehead
Swampscott (more…)
2023 Sales Continue Strongly over List Price
The chart and table below show how the percentage of sales (of SFHs and Condos) dropped in the last few months of 2022 and early months of 2023, befre recovering strongly from the spring of 2023 onwards.
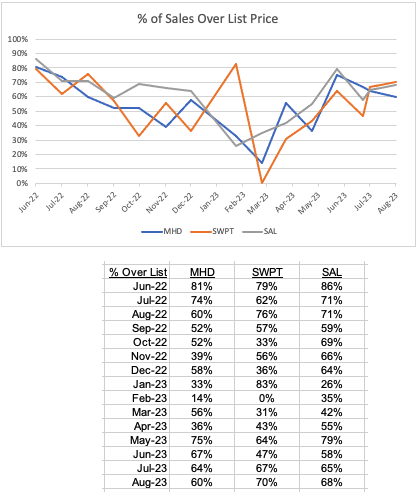
Note that the actual numbers in some months are quite small which can lead to fluctuations – but the overall message is clear: most properties continue to sell over list price.
And these recent articles:
August Sales still mostly over List Price
2023 Sales Continue Strongly over List Price
No signs of improvement in September Housing Inventory (more…)
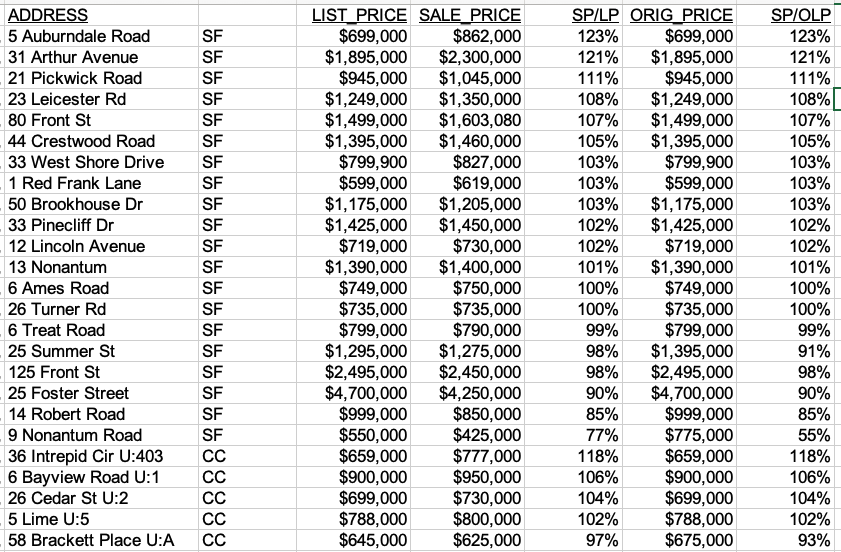
June Sales in Swampscott mostly At or Over List Pricce
11 of 15 sales in Swampscott in June were at or above List Price:

And these recent articles:
Marblehead Mid-year 2023 Market Stats
Swampscott Mid-year 2023 Market Stats
Salem Mid-year 2023 Market Stats
Economic and mortgage commentary
Two signs Inflation is Slowing (more…)
Bidding Wars return to the North Shore
One of the features of the housing market boom of 2020-2022 was the very high number of sales above list price, an indication that there were multiple offers resulting in bidding wars.
And a logical consequence of the market returning to more normal conditions would be to expect a decline in bidding wars, leading to fewer sales taking place above list price.
Has this actually happened?
Let’s look at the sales in last 12 months in Marblehead, Swampscott and Salem. Here is the chart: (more…)
Q1 2023 Market Stats
Q1 2023 Market Stats for selected towns (stats for other towns in Essex County are available on request)
Amesbury Q1
Beverly Q1
Gloucester Q1
Marblehead Q1
Salem Q1
Swampscott Q1
And these recent articles: (more…)
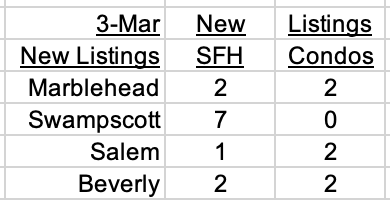
New Listings week ending March 3
A spurt in New Listings in Swampscott this week:
Click on these links for details: (more…)
How Swampscott’s FY2022 Property Tax is Calculated
Swampscott’s residential tax rate will drop from $13.80 in Fiscal Year 2021 to $12.83 in FY 2022 (and down from a high of $18.84 in FY 2013). The FY 2022 rate will be the lowest since 2006.
Commercial and industrial property is surcharged at 170%, as in FY 2021, resulting in a tax rate of $23.20, down from $24.90 in FY 2021 (and a high of $35.02 in FY 2013).
The average SFH tax bill has been flat in recent years:
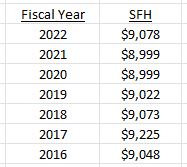
“Every year since 2017, Swampscott’s average, single-family home tax bill has dropped or stayed level – and that’s unique, exceptional,” said Town Administrator Sean Fitzgerald. “You won’t be able to find another community in the commonwealth that has spent as much time really trying to find balance and stability. Many peer communities have increased their taxes every year over the past four years.”
How is the rate calculated?
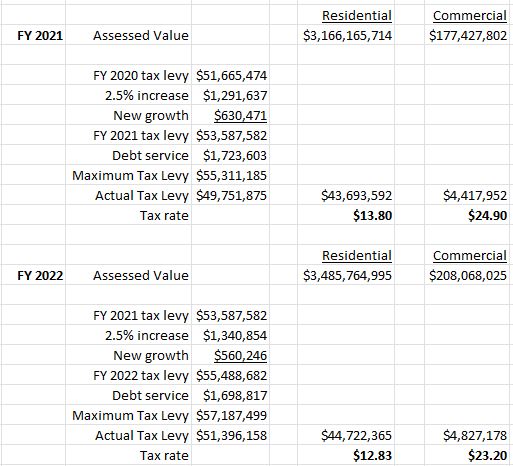
The method of calculating the tax rate is quite simple: take the $ amount of the previous year’s tax levy, add 2.5% for Proposition 2 1/2, and also add any new growth (such as new construction or a condo conversion). This figure is the new maximum tax levy. To this figure is added debt service – the Principal and Interest payable on the town’s debt.
Note that in recent years, Swampscott has not assessed the maximum allowed under this formula, a decision that has reduced the tax bill for residents.
Here are the numbers for FY 2021 and FY 2022, remembering that the FY 2022 runs from July 2021 to June 2022.
The Tax Rate
The actual tax rate depends upon the total Assessed Value of all property: residential, and commercial, industrial and personal (CIP). The tax rate is calculated by dividing the total dollar amount to be raised from each class by the Assessed Value of each class. Thus, the headline tax rate will also fluctuate depending upon the direction of Assessed Values.
In simplistic terms, if we assume that the $ amount to be raised increases by a little more than 2 1/2% each year, then if the average Assessed Value also increases by a little more than 2 1/2% the tax rate will be unchanged. If the increase in Assessed Values is less than 2 1/2%, then the tax rate will rise. And if the increase in Assessed Values is more than 2 1/2% then the tax rate will fall. In recent years Assessed Values have been increasing significantly more than 2 1/2% allowing for the tax rate to decline sharply.
Looking at the Swampscott residential tax rate, in FY 2021 it was $13.80, achieved by dividing $43.7 million raised from residential homeowners by the residential AV of $3.2 billion. In FY 2022 the amount to be raised from residential taxpayers is set to increase slightly to $44.7 million, but because the total residential AV increased by 10% to $3.5 billion, the headline tax rate has dropped to $13.20, the lowest figure since 2006.
Comment
The residential real estate market in Swampscott was stable in 2020 (and 2020 prices are the basis for the FY 2022 tax rate), with the median price of Single Family Homes sold rising by 2.1%. Sales in any year represent only a small percentage of the total stock so it does not follow that assessed values calculated by the town will mirror these movements.
As to the tax rate for FY 2023, 2022 ( the basis for FY 2021) is a different story with the median Single Family price increasing 16% in the first half of the year. The actual rate will depend on a number of factors: the amount of debt service, how much of the maximum tax levy is assessed, and the shift to the CIP class being three of them. But unless there is a dramatic change in the market in the second half of 2021 the likelihood is that the actual tax rate will decline significantly in FY2023.
From a residential real estate perspective, the substantial decline in the tax rate in recent years and the stability in tax bills are both very welcome news and are clearly encouraging more people to decide both to live and work in Swampscott.
Market Analyst | Team Harborside | teamharborside.com
REALTOR®
Sagan Harborside Sotheby’s International Realty
One Essex Street | Marblehead, MA 01945
m 617.834.8205
www.OliverReportsMA.com
Andrew.Oliver@SothebysRealty.com
Sotheby’s International Realty® is a registered trademark licensed to Sotheby’s International Realty Affiliates LLC. Each Office Is Independently Owned and Operated
“If you’re interested in Marblehead, you have to visit the blog of Mr. Andrew Oliver, author and curator of OliverReports.com. He’s assembled the most comprehensive analysis of Essex County we know of with market data and trends going back decades. It’s a great starting point for those looking in the towns of Marblehead, Salem, Beverly, Lynn and Swampscott.”
__________________
Andrew Oliver
REALTOR® | Market Analyst | DomainRealty.com
Naples, Bonita Springs and Fort Myers
Andrew.Oliver@DomainRealtySales.com
m. 617.834.8205
www.AndrewOliverRealtor.com
www.OliverReportsFL.com
Swampscott 2022 Housing Market Review
Single Family Homes (SFH)
The SFH Median Price increased 14% in 2022, while sales dropped to the lowest level since 2010
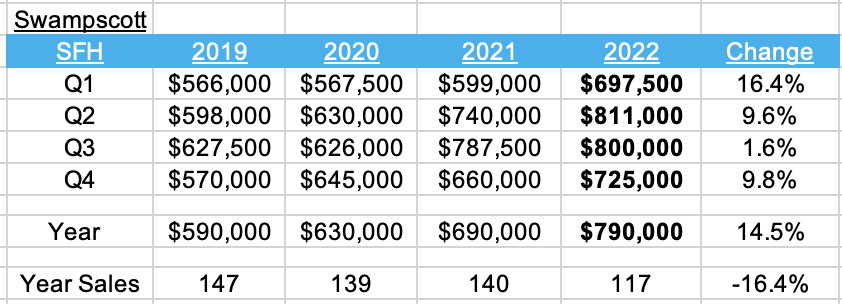
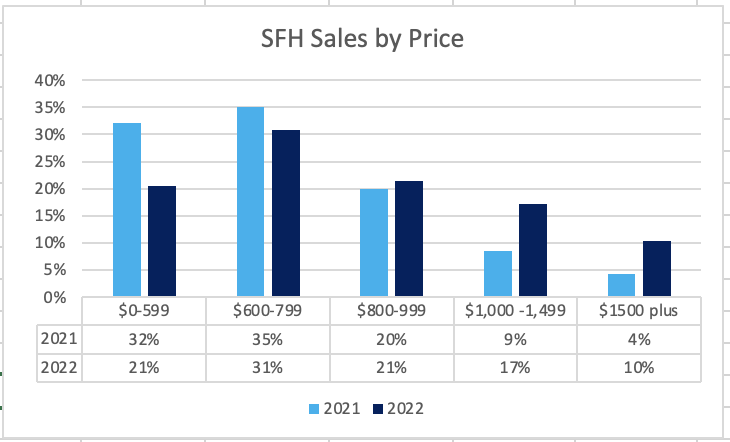
The share of sales over $800,000 increased from 33% in 2021 to 48% in 2022, driving the median price for the year to almost $800,000. 32 of the 117 sales were over $1 million in 2022, compared with 18 in 2021.
Condos
The median Condo sold price increased 2.5%, while sales dropped to the lowest level since 2016. The share of sales over $400,000 increased slightly from 57% to 61% and, therefore, the median price also increased slightly. (more…)
January Sales in Marblehead and Swampscott
A small sample for January, but two observations:
1. the number of properties selling above list price was lower overall, and the amount over list decreased – there were no sales at 110% or more.
2. 4 of the properties had price cuts – and all 4 sold for less than their reduced price.
Read February Inventory as low as this weekend’s temperature
(more…)
December sales in Marblehead and Swampscott still mostly above List Price
The small number of December sales in Marblehead and Swampscott continued to show strength.
Marblehead
6 of 9 SFH sales in December – and 1 of 3 Condo sales – were over List price.
Swampscott
6 of 9 SFH sales in October were at or over List price, while 1 of the Condo sales was at List and one just below. (more…)
Marblehead and Swampscott November sales still strong
November sales in Marblehead and Swampscott continue to show strength.
Marblehead
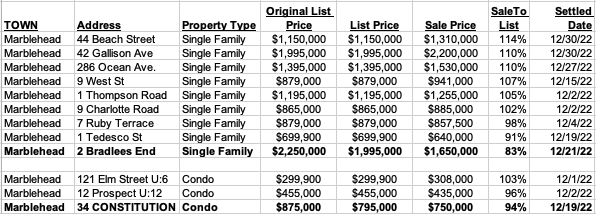
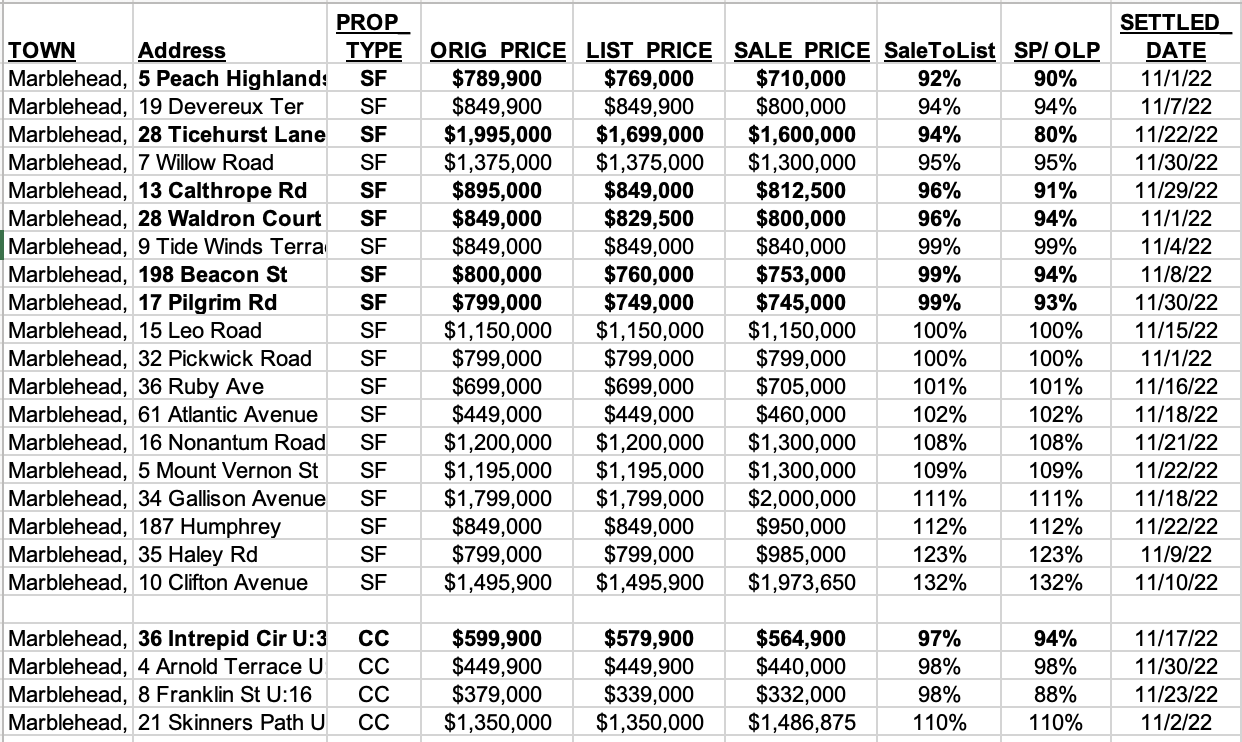
10 of 19 SFH sales in November were at or over List price, with 2 sales at 23% and 32% over list. Just 1 of the 4 Condo sales was over List.
Swampscott
6 of 10 SFH sales in October were at or over List price (5 over the Original List Price), while 5 of the 6 Condo sales were at or above List.
Comment
While sales continue to be strong – and often strongly above list price – it is interesting to note that 8 of the 14 SFHs currently available for sale in Marblehead have had price reductions, while 4 of the 9 in Swampscott have also seen price cuts – or “adjustments” or “improvements” as we like to call them.
Note also that in November, all but 1 of the sales where the price had been reduced subsequently took place below the reduced price.
The sample is small, but the implication is clear: over-pricing in this market leads to a lower sale price.
Swampscott Q3 2022 Report: Median Price hits $800,000
The median price of the Single Family Homes (SFH) sold in Swampscott in the first 9 months of 2022 (YTD Q3) increased 12% to $800,000. The median condo price also increased 12% YTD Q3 to $447,500.
Single Family Homes (SFH)
The median price of the SFHs sold in Swampscott in the first 9 months of 2022 (YTD Q3 2022) increased 12% to $800,000 on the smallest number of sales since 2012.
As the percentage of sales over $800,000 increased from 36% YTD in 2021 to 51% YTD in 2022, so the median price moved from just over $700,000 to $800,000. Sales over $1 million YTD increased from 13 to 25. (more…)
Recent Comments