
New Listings mid-week June 6
The pace of new listings continues to quicken, but well-priced and well-presented properties are selling quickly:
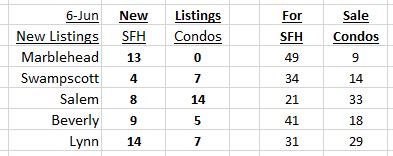
Marblehead new listings
Swampscott new listings
Salem new listings
Beverly new listings
Lynn new listings
Open Houses Sunday June 3
Here are today’s Open Houses in Marblehead, Swampscott, Salem, Beverly and Lynn:

Marblehead Open Houses
Swampscott Open Houses
Salem Open Houses
Beverly Open Houses
Lynn Open Houses
Q1 2018 Housing Market reports for North Shore towns
Please click on North Shore towns Q1 2018 market reports for details of the Q1 markets in Marblehead, Swampscott, Salem, Beverly, Lynn, Rockport and Gloucester, as well as for Essex County overall.
Below is a a report on property tax rates for all 34 cities and towns in Essex County, followed by more detailed reports on the Q1 markets, for both SFHs and Condos, in Marblehead, Swampscott, Salem, Beverly, Lynn, Gloucester and Rockport. Similar information is available for other towns on request.
Essex County 2018 Property Tax Rates: a Town by Town guide
Property tax rates for FY 2018 for all 34 cities and towns in Essex County have been announced. Below is a map (which you can download by clicking here), so that you can compare tax rates in neighboring towns, followed by the tax rates for each town the last four years, listed from low to high using 2018 tax rates.
The median tax rate for 2018 is $14.30, down slightly from 2017’s $14.41, while the average tax rate has dropped from $14.41 to $14.17. The highest taxed town, Amesbury, has a rate 34% higher than the County average, while the lowest, Nahant, is 29% below the average. Or put another way, the highest tax rate in Essex County is 88% higher than the lowest.
Here are the individual reports:
Essex County Q1 2018 housing market: prices continue to increase
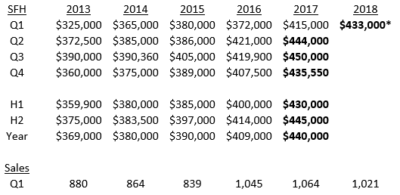
The table in this report shows the median SFH price for each town for the last three years; and the median price and sales for Q1 for 2017 and 2018. The mid-year data, which I shall publish in mid-July, will give a better feel for the market in individual cities and towns, but these numbers support the general perception that the housing market in Essex County continues to show price increases.
Essex County Q1 2018 Housing Market By The Numbers
The median price of SFHs sold in the 34 cities and towns of Essex County in Q1 2018 increased from Q1 2017 but was in line with late 2017. Sales were down slightly.
The median price of the condos sold in Essex County was consistent with recent quarters, while sales dropped from a year ago.
Marblehead Q1 2018 By The Numbers
Reflecting the continuing shortage of inventory, sales of SFHs in Q1 2018 dropped from 36 to 26, while the median sale price exceeded $700,000 for the third consecutive quarter.
Swampscott Q1 2018 Housing Market By The Numbers
The median price of the SFHs sold in Q1 2018 remained over $500,000 for the 6th consecutive quarter. While still very low, inventory has actually picked up a little in recent weeks. The condo market is active, with new development and new conversions driving median prices higher.
Salem Q1 2018 Housing Market By The Numbers
With sales flat year on year, the median price of the SFHs sold moved strongly past $400,000 in Q1, while the median price of condos sold staying comfortably above $300,000.
Beverly Q1 2018 Housing Market By The Numbers
The median price of the SFHs sold in Q1 208 was down slightly from last year on stable sales, while the impact of the sales at Elliott Landing from late 2016 into 2017 (65 sales with a median price around $500,000) is now unwinding from the statistics.
Lynn Q1 2018 Housing Market By The Numbers
The median price of SFHs sold in Q1 remained steady with the second half of 2017, while sales increased. Condo sales declined somewhat, while the median price was in line with last year’s overall number.
Gloucester Q1 2018 Housing Markey By The Numbers
The median price of the SFHs sold in Q1 2018, the quarter with the lowest sales of the year,was consistent with recent quarters, while sales dipped a little. Q1 is a quiet quarter for sales, but 2018 saw several new condo conversions or new construction sales, which typically are higher-priced units.
Rockport Q1 2018 Housing Market By The Numbers
When there is a very small number of sales – as In Rockport in Q1 2018 – statistics tell us very little – which is why I wait until mid-year to publish on such markets.Please contact me for the latest information about the market in Rockport.
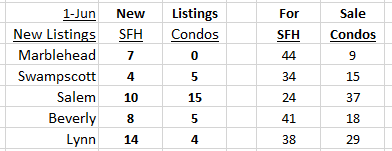
New Listings after Memorial Day
Here are the latest new listings:
Sagan Harborside Sotheby’s International Realty
Marblehead new listings
Swampscott new listings
Salem new listings
Beverly new listings
Lynn new listings
Open Houses this weekend
Here are this weekend’s Open Houses in Marblehead, Swampscott, Salem, Beverly and Lynn
Saturday

Marblehead Open Houses
Swampscott Open Houses
Salem Open Houses
Bweverly Open Houses
Lynn Open Houses
Sunday
Marblehead Open Houses
Swampscott Open Houses
Salem Open Houses
Beverly Open Houses
Lynn Open Houses
Essex County Q1 2018 Housing Market By The Numbers
(Click here to download a copy of this report.)
The median price of SFHs sold in the 34 cities and towns of Essex County in Q1 2018 increased from Q1 2017 but was in line with late 2017. Sales were down slightly.
Condos
The median price of the condos sold in Essex County was consistent with recent quarters, while sales dropped from a year ago.
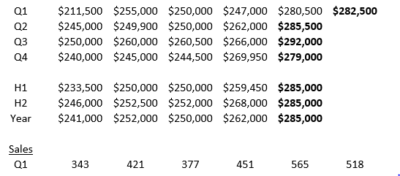
*Figures in bold represent record levels
www.OliverReports.com
Andrew Oliver
Sagan Harborside Sotheby’s International Realty
617.834.8205
andrew.oliver@sothebysrealty.com
Recent Comments