New Listings, Inventory week ending July 12
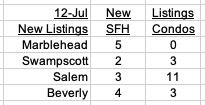
Here are the New Listings and inventory numbers:
Click on these links for details:
Marblehead New Listings
Swampscott New Listings
Salem New Listings
Beverly New Listings
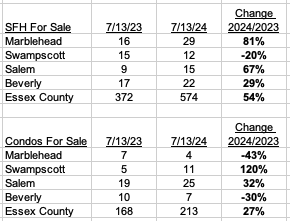
Here are the latest inventory numbers:
And read these recent articles:
The Federal Reserve’s Analysis Paralysis
July Housing Inventory and H1 Sales to List Price
My Property Tax reports mentioned at Town Meeting
Marblehead Q1 2024 Market Summary
Swampscott Q1 2024 Market Summary
Salem Q1 2024 Market Summary
Essex County Q1 2024 Market Summary
Why Mortgage Rates will fall in 2024
The Federal Reserve’s Analysis Paralysis
In November 2023, I wrote: “The question now is whether the Federal Reserve, having been extremely slow to start raising rates and reversing Quantitative Easing, will be similarly late in easing (rates). The Fed claims to be data dependent, but data tells us what happened in the past – and the Fed’s actions impact the future.”
The answer to that question is “yes” – and here we are, 8 months later, and the Fed is still “data dependent”, although this year’s mantra has become “higher for longer.”
2022
While nearly everybody outside the Fed now accepts that it kept interest rates “too low for too long”, I published the following articles: (more…)
Housing Inventory at highest level since 2020
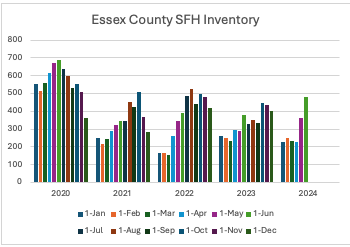
The inventory of Single Family Homes (SFH) more than doubled from April to June, taking the level to the highest level in June since 2020:
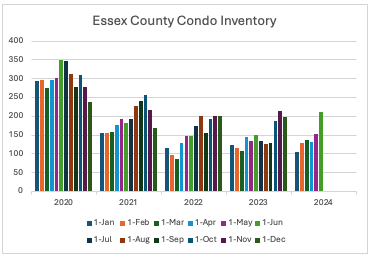
Condo Inventory increased 60% from April to June and also reached the highest level in June since 2020:
And these recent articles:
Marblehead House sell for $1.2 million OVER List Price
Marblehead Q1 2024 Market Summary
Swampscott Q1 2024 Market Summary
Salem Q1 2024 Market Summary
Essex County Q1 2024 Market Summary
How was MY assessment calculated? Q&A with Marblehead Assessor Karen Bertolino
My Marblehead Current article on Property Taxes
Marblehead FY 2024 Property Tax Explained
If you – or somebody you know – are considering buying or selling a home and have questions about the market and/or current home prices, please contact me on 617.834.8205 or ajoliver47@gmail.com.
Andrew Oliver, M.B.E.,M.B.A.
Market Analyst | Team Harborside | teamharborside.com
REALTOR®
m 617.834.8205
www.OliverReportsMA.com
““If you’re interested in Marblehead, you have to visit the blog of Mr. Andrew Oliver, author and curator of OliverReportsMA.com. He’s assembled the most comprehensive analysis of Essex County we know of with market data and trends going back decades. It’s a great starting point for those looking in the towns of Marblehead, Salem, Beverly, Lynn and Swampscott.”
“Thank you for the wonderful, wonderful job you do for the community (explanation of property tax process and calculation) – it is so helpful and so clearly explained.”
New Listings, Inventory mid-week May 15
Here are the latest New Listings:
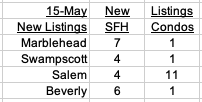
Click on these links for details:
Marblehead New Listings
Swampscott New Listings
Salem New Listings
Beverly New Listings
And here are the latest inventory numbers:

And these recent articles:
My Property Tax reports mentioned at Town Meeting
Marblehead Q1 2024 Market Summary
Swampscott Q1 2024 Market Summary
Salem Q1 2024 Market Summary
Essex County Q1 2024 Market Summary
Why Mortgage Rates will fall in 2024
New Listings, Inventory week ending April 19
Here are the latest New Listings:
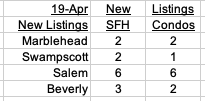
Click on these links for details:
Marblehead New Listings
Swampscott New Listings
Salem New Listings
Beverly New Listings
And here are the latest inventory numbers:
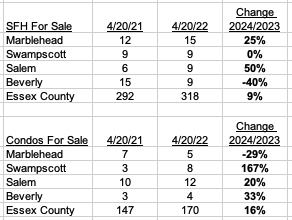
And these recent articles:
MARBLEHEAD 2023 MARKET REPORT and 5-YEAR REVIEW
SWAMPSCOTT 2023 MARKET REPORT and 5-YEAR REVIEW
SALEM 2023 MARKET REPORT and 5-YEAR REVIEW
ESSEX COUNTY 2023 MARKET REPORT and 5-YEAR REVIEW
How was MY assessment calculated? Q&A with Marblehead Assessor Karen Bertolino
My Marblehead Current article on Property Taxes
Marblehead FY 2024 Property Tax Explained
Why Mortgage Rates will fall in 2024
How a tax break of up to $3,200 can help heat your home more efficiently this winter
Conventional Mortgage Loan Limits increased for 2024
INFLATION and RECESSION UPDATE
New Listings and Inventory week ending February 2
Just a few new listings this week:
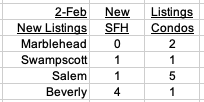
Click on these links for details:
Marblehead New Listings
Swampscott New Listings
Salem New Listings
Beverly New Listings
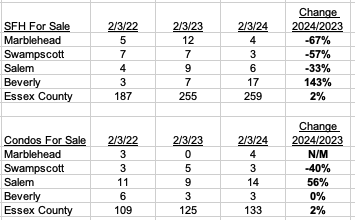
While latest inventory numbers generally in Essex County are similar to last year’s levels, the declines in 4 towns on the North Shore are dramatic:
And these recent articles:
MARBLEHEAD 2023 MARKET REPORT and 5-YEAR REVIEW
SWAMPSCOTT 2023 MARKET REPORT and 5-YEAR REVIEW
SALEM 2023 MARKET REPORT and 5-YEAR REVIEW
ESSEX COUNTY 2023 MARKET REPORT and 5-YEAR REVIEW
How was MY assessment calculated? Q&A with Marblehead Assessor Karen Bertolino
My Marblehead Current article on Property Taxes
Marblehead FY 2024 Property Tax Explained
Why Mortgage Rates will fall in 2024
How a tax break of up to $3,200 can help heat your home more efficiently this winter
Conventional Mortgage Loan Limits increased for 2024
INFLATION and RECESSION UPDATE
How was MY assessment calculated? Q&A with Marblehead Assessor Karen Bertolino
This is the thrid part in my series about the property tax assessment process. Links to the first two parts are included at the end of this 9 question Q&A.
Q. How is my property assessed each year?
A. All property is valued every year and is based on calendar year market sales in Marblehead. Fiscal Year 2024 began July 1, 2023, and is based on what existed January 1, 2023, so the preceding calendar year 2022 primarily is used for the basis of valuations.
Assessed values are based on fair market value using arm’s length sales in 2022. Our analysis does not use any foreclosures, short sales, family, estate, or private sales.
Components of an arm’s length transaction are a willing buyer and seller, who are unrelated, acting in their own best interest, neither under undue influence, the property is for sale in the open marketplace and the price represents the nominal consideration for the property sold unaffected by special or creative financing or sales concessions granted by anyone associated with the sale.
Every sale is reviewed to ensure that it is an arm’s length transaction by reviewing deeds, speaking with realtors and brokers knowledgeable about the sale, reviewing Multiple Listing Service (MLS), sale questionnaires and site inspections. Every year the Town Assessor is out in the field to observe changes in neighborhood conditions, trends and property characteristics.
The DOR criteria states that valuations must be between 90%-110% of fair market value. The Board of Assessors values close to 100% of fair market value depending on what is happening in the marketplace.
Additionally, appraising and assessing are based on the same principles and procedures of valuation with 2 distinct differences: number of homes viewed and market timeframe.
For example, if you hired an appraiser to value your home on July 1, 2023, they will compare your home to 3 to 6 properties that ideally sold on your street, if not in your neighborhood, if not in a similar neighborhood in town using current market sales. The comparable homes will be adjusted (grade, square footage, etc.) to arrive at an opinion of value for your home.
In Assessment, we are looking at all the single-family homes (condo’s, etc.) that sold in a past market, which in FY2024 is calendar year 2022. A statistical analysis of this data is performed by breaking it into sub-groups (gross living area, neighborhood, sales price, etc.) and then applied to market sales using the DOR criteria mentioned above.
Q. Are there different districts in town and do they have different values attributed to them?
A. Location is one of the biggest factors that impacts market value. Neighborhood codes are based on where your property is in town and take into consideration attributes such as style, age, etc. According to the Dictionary of Real Estate Appraisal, a neighborhood is, “A group of complementary land uses; a congruous grouping of inhabitants, buildings, or business enterprises.” Adjustments are made to the neighborhoods and properties as the marketplace dictates.
Q. Why has my assessment gone up so much while others have seen smaller increases? (more…)
Most Sales Still Over List Price
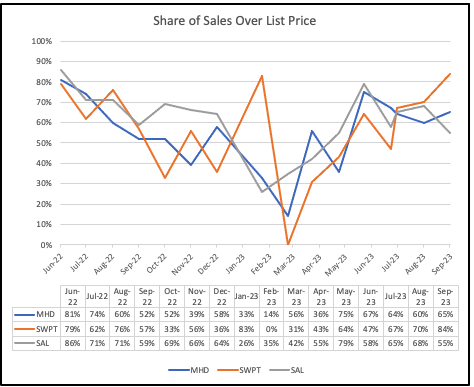
Sales in September in Marblehead, Swampscott and Salem continued to be mostly over List Price:
And read these recent articles:
Most Sales Still Over List Price
Core Inflation Prices Barely Budged in August
October Inventory shows Sharp Jump from September</a.
Credit Score Change Could Help Millions of Buyers
August Sales still mostly over List Price
2023 Sales Continue Strongly over List Price (more…)
October Inventory shows Sharp Jump from September
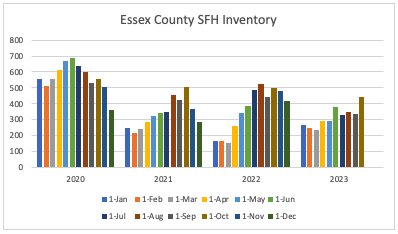
Overall Inventory in Essex County has been on a roller-coaster this year in terms of comparison with a year ago.
Single Family Homes (SFH)
In the early months SFH was up 50% or more from the extremely low levels in 2022. By the summer, YOY inventory was down by around 1/3. October showed an increase of 1/3 from September 1, bringing the YOY deficit to just 11%.
Condos
Condo inventory showed a similar, if less exaggerated, pattern. The 45% increase from September to October brought inventory levels in line with 2022’s, but still well below those in 2020 and 2021.
(more…)
No signs of improvement in Housing Inventory
Single Family Homes (SFH)
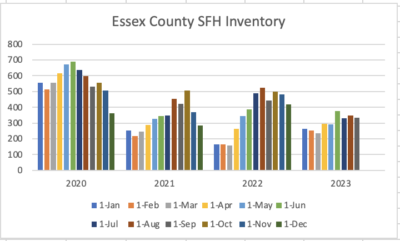
SFH inventory did not have the usual early summer bump this year and is now running 25% below last year’s level:
Condos
Condo inventory is even more depressed and is now 45% lower thn it was in 2021:
(more…)
Housing Inventory Drops; Mortgage Rates Rise
Single Family Homes (SFH)
SFH inventory did not have the usual early summer bump this year and is now running 25% below last year’s level:
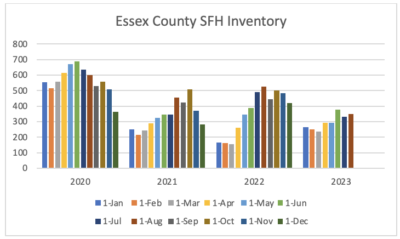
Condos
Condo inventory is een more depressed and is now 1/3 lower thn it was in 2022:
(more…)
New Listings week ending July 21
Here are the latest New Listings:
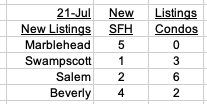
Click on these links for details:
Marblehead New Listings
Swampscott New Listings
Salem New Listings
Beverly New Listings
Inventory is now showing a sharp drop from last year:
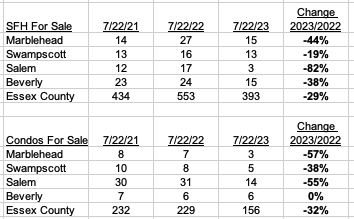
And these recent articles:
Marblehead Mid-year 2023 Market Stats
Swampscott Mid-year 2023 Market Stats
Salem Mid-year 2023 Market Stats
Economic and mortgage commentary
Two signs Inflation is Slowing (more…)
July Inventory shows Sharp Drop
Single Family Homes (SFH)
SFH inventory dropped sharply in July from the previous month 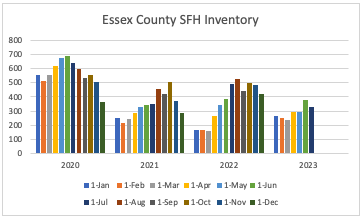
Condos
Condo inventory also dropped from June.
(more…)
Is the U.S. Housing Market at a Crossroads?
Homes reached record prices in early 2022 – so is the current market a housing recession or just a market correction?
Here are some extracts from an article Market at the Crossroads on the Florida Realtors website, with my comments and links to recent articles at the end.
Is there a housing slowdown?
There is widespread consensus that the housing market has experienced a drastic drop-off in activity since its pandemic-prompted heights.
The housing market is “not like the volatile stock market, always going up and down; the housing market moves at a different, slower pace. “The market simply could not, and was never expected to, grow at that pace indefinitely,” Neda Navab, president of brokerage operations at real estate company Compass said. “Whether this trend will continue long enough for the market to enter a true ‘recession,’ or if this is simply the start of an expected ‘correction’ to historic norms, still remains to be seen.”
The case for a housing correction (more…)
Pre-Labor Day Inventory drops
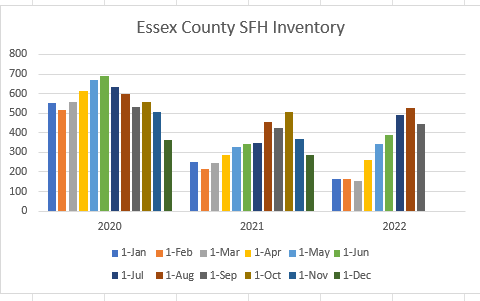
The drop in Single Family inventory before Labor Day, as sellers delay listing, was sharper than usual this year. We will get a better read on Inventory in the next couple of weeks.
Single Family Homes
Condos
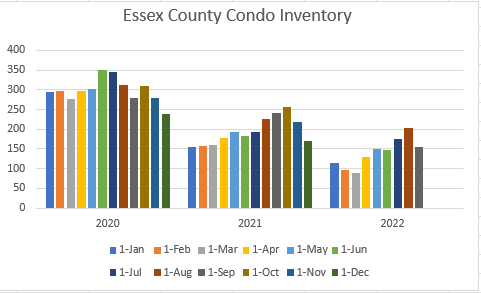
Condo inventory continues to lag both 2020 and 2021 levels.

Recent Comments