In November 2023, I wrote: “The question now is whether the Federal Reserve, having been extremely slow to start raising rates and reversing Quantitative Easing, will be similarly late in easing (rates). The Fed claims to be data dependent, but data tells us what happened in the past – and the Fed’s actions impact the future.”
The answer to that question is “yes” – and here we are, 8 months later, and the Fed is still “data dependent”, although this year’s mantra has become “higher for longer.”
2022
While nearly everybody outside the Fed now accepts that it kept interest rates “too low for too long”, I published the following articles: (more…)
Sellers nationwide will likely see the best conditions for listing prices, buyer demand and sales pace from April 14 to April 20, making it the best time to sell, Realtor.com said.
Realtor.com detailed why the April time period is the best time to sell:
Above-average prices – The prices of homes listed during this week have historically been 1.1% higher than the average week and are typically 10.4% higher than at the start of the year. If 2024 follows last year’s seasonal trend, the national median listing price could be $7,400 higher than the average week, and $34,000 more than at the start of the year.
Above-average buyer demand – The more buyers looking at homes, the better it is for offers and sales. Historically, this week saw 18.4% more views per listing than the typical week, but in 2023 this week got 22.8% more views per listing than the average week during the year. Demand will in part depend on mortgage rates – falling rates may increase spring demand, while steady or rising rates may prompt some buyers to hold off.
Faster market pace – Thanks to above-average demand, homes tend to sell more quickly during this week. Historically, homes actively for sale during the week of April 14 sold 17%, or about 9 days, faster than in the average week. In 2023, this week typically saw homes on the market for 46 days on average, 6 days faster than the year’s average. With inventory levels remaining low, sales may happen more quickly as buyers compete for fewer properties.
Less competition from other sellers – With past seasonal trends likely to persist, there would be 13.7% fewer sellers in the market this week compared to the average week during the year. Active inventory was 14.8% higher in February versus last February, but still 39.7% lower than pre-pandemic levels. This gap means there will continue to be opportunities for sellers entering the market this spring.
Below-average price reductions – Price reductions tend to be lowest in late winter and early spring as buyer activity ramps up. Historically, about 24.6% fewer homes have had a price decrease this week compared to the average week of the year. In 2023, this week saw about 8,000 fewer listings with price reductions compared to the average week of the year. (Realtor.com)
If you – or somebody you know – are considering buying or selling a home and have questions about the market and/or current home prices, please contact me on 617.834.8205 or ajoliver47@gmail.com.
Andrew Oliver, M.B.E.,M.B.A.
REALTOR®
m 617.834.8205
www.OliverReportsMA.com
www.OliverReportsFL.com
Stuart St James, Inc.
1 Washington Mall #3048
Boston, MA 02108
“If you’re interested in Marblehead, you have to visit the blog of Mr. Andrew Oliver, author and curator of OliverReportsMA.com. He’s assembled the most comprehensive analysis of Essex County we know of with market data and trends going back decades. It’s a great starting point for those l
While inflation rose 3.5% year-to-year in Aug. – still above the Fed’s 2% goal – it was only up 0.1% month-to-month after backing out higher gas prices.
Core inflation slows
But excluding the volatile food and gas categories, “core” inflation rose by the smallest amount in almost two years in August, evidence that it’s continuing to cool. Fed officials pay particular attention to core prices, which are considered a better gauge of where inflation might be headed.
Core prices rose just 0.1% from July to August, down from July’s 0.2%. It was the smallest monthly increase since November 2021.
Compared with a year ago, core prices were up 3.9%, below July’s reading of 4.2%. That, too, was the slowest such increase in two years. (more…)
The nation’s consumer bureau took a first step to erase medical debt from credit reports and lending decisions because that type of debt “has little predictive value.”
The Consumer Financial Protection Bureau (CFPB) outlined proposals under consideration – moves that it says would help families recover from medical crises, stop debt collectors from coercing people into paying bills they may not owe, and ensure that creditors don’t rely on data that is often plagued with inaccuracies and mistakes.
“Research shows that medical bills have little predictive value in credit decisions, yet tens of millions of American households are dealing with medical debt on their credit reports,” says CFPB Director Rohit Chopra. “When someone gets sick, they should be able to focus on getting better rather than fighting debt collectors trying to extort them into paying bills they may not even owe.”
“Access to health care should be a right and not a privilege,” Vice President Kamala Harris told reporters as she helped CFPB make the announcement. “These measures will improve the credit scores of millions of Americans so that they will better be able to invest in their future.” (more…)
While $1M signified luxury property a short while ago, it’s now 8% of the nation’s housing stock – but a large percentage of those homes are still in Pacific Coast states..
The share of homes worth seven figures is on an upswing after dipping to a 12-month low (7.3%) in February because prices are rising on a year-over-year basis after a decline early in the year.
Overall, the median U.S. home-sale price rose 3% in July, the biggest increase since last November, according to Redfin, with luxury home prices rising even faster – up 4.6% year over year to $1.2 million in the second quarter.
Elevated mortgage rates discourage potential home sellers, who are staying put to keep their relatively low mortgage rates. As a result, inventory dropped so low that buyers still in the market are competing for those few homes that are for sale. That’s driving up home prices and pushing many of those listings above the million-dollar mark.
“The supply shortage is making many listings feel hot,” said Redfin Economics Research Lead Chen Zhao. “In most of the country, expensive properties that are in good condition and priced fairly are attracting buyers and in some cases bidding wars, mostly because for-sale signs are few and far between right now.”
The share of homes worth seven figures has doubled since before the pandemic. In June 2019, just over 4% of homes were valued at $1 million or more.
East Coast metros gain most $1 million-plus homes
Over one-quarter (25.8%) of homes in the Bridgeport, CT metro – which has many popular New York City suburbs – are worth at least $1 million, up from 23.1% a year ago, the biggest increase of the metros analyzed. It’s followed by Boston, where the share increased from 20.3% to 21.5%, and Newark, N.J. (8.7% to 9.7%). (more…)
You may feel a bit unsure about what’s happening with home prices and fear whether or not the worst is yet to come. That’s because today’s headlines are painting an unnecessarily negative picture. If we take a year-over-year view, home prices did drop some, but that’s because we’re comparing to a ‘unicorn’ year when prices peaked well beyond the norm.
To avoid an unfair comparison to that previous peak, we need to look at monthly data. And that tells a very different and much more positive story. While local home price trends still vary by market, here’s what the national data tells us.
The graphs below use recent monthly reports from three sources to show the worst home price declines are already behind us, and prices are appreciating nationally.
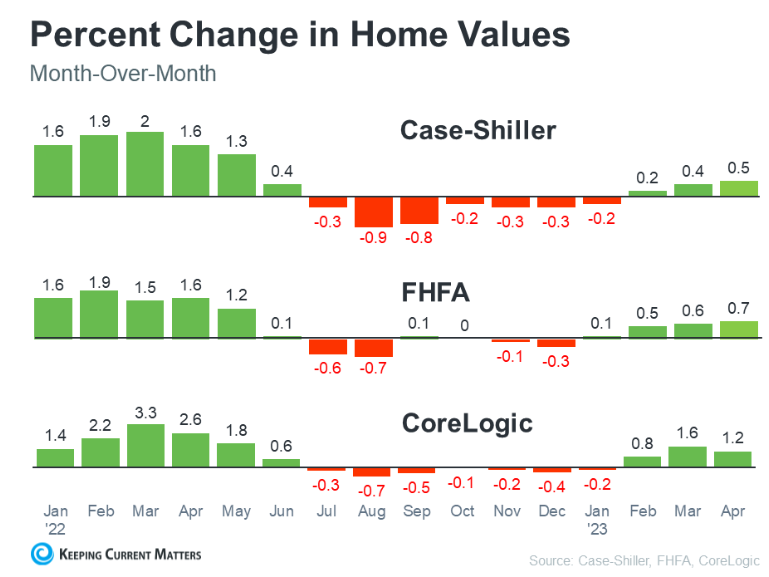
Looking at this monthly view, we can see the past year in the housing market can be divided into two parts. In the first half of 2022, home prices were going up, and fast. However, starting in July, prices began to go down (shown in red in the graphs above). By around August or September, the trend started to stabilize. But, looking at the most recent data for early 2023, these graphs also show that prices are going up again.
The fact that all three reports show prices have been going up for three or more straight months is an encouraging sign for the housing market. The month-over-month data indicates a national shift is happening – home prices are rising again.
Craig J. Lazzara, Managing Director at S&P Dow Jones Indices, says this about home price trends: (more…)
Existing-home sales reversed a 12-month slide in February, registering the largest monthly percentage increase since July 2020, according to the National Association of Realtors® (NAR). Month-over-month sales rose in all four major U.S. regions – but they also all saw year-over-year declines.
February median existing home prices fell for the first time in 131 months– almost eleven years – according to NAR. The median existing-home price for all housing types was $363,000, a decline of 0.2% from February 2022 ($363,700), as prices climbed in the Midwest and South yet waned in the Northeast and West.
Total existing-home sales – completed transactions that include single-family homes, townhomes, condominiums and co-ops – climbed 14.5% from January to a seasonally adjusted annual rate of 4.58 million in February. Year-over-year, sales fell 22.6% (down from 5.92 million in February 2022).
Total housing inventory at the end of February was 980,000 units, identical to January and up 15.3% from one year ago (850,000). Unsold inventory sits at a 2.6-month supply at the current sales pace, down 10.3% from January but up from 1.7 months in February 2022.
Properties typically remained on the market for 34 days in February, up from 33 days in January and 18 days in February 2022. Still, most homes (57%) sold in February were on the market for less than a month.
Buyer types (more…)
National Association of Homebuilders (NAHB) Chief Economist Robert Dietz recently provided this housing industry overview in the bi-weekly e-newsletter Eye on the Economy.
Housing data for the end of 2022 illustrate a market continuing to weaken because of low housing affordability, largely as a result of elevated mortgage interest rates. At the start of 2023, the average 30-year fixed mortgage rate is near 6.5%, down from a near 20-year high of 7.1% in early November.
However, forecasters expect the Federal Reserve will end its path of rate increases at the end of the first quarter. This should lead to sustainable declines for mortgage rates in the second half of 2023 and into 2024, enough to spur a rebound for single-family construction.
And more construction is needed over the long term: A new NAHB study estimates the housing market is underbuilt by 1.5 million homes. (more…)
Homes reached record prices in early 2022 – so is the current market a housing recession or just a market correction?
Here are some extracts from an article Market at the Crossroads on the Florida Realtors website, with my comments and links to recent articles at the end.
Is there a housing slowdown?
There is widespread consensus that the housing market has experienced a drastic drop-off in activity since its pandemic-prompted heights.
The housing market is “not like the volatile stock market, always going up and down; the housing market moves at a different, slower pace. “The market simply could not, and was never expected to, grow at that pace indefinitely,” Neda Navab, president of brokerage operations at real estate company Compass said. “Whether this trend will continue long enough for the market to enter a true ‘recession,’ or if this is simply the start of an expected ‘correction’ to historic norms, still remains to be seen.”
The case for a housing correction (more…)
According to this report from Keeping Current Matters the major reason for the housing crash 15 years ago was a tsunami of foreclosures. With much stricter mortgage standards and a historic level of homeowner equity, the fear of massive foreclosures impacting today’s market is not realistic.
Homeownership has become a major element in achieving the American Dream. A recent report from the National Association of Realtors (NAR) finds that over 86% of buyers agree homeownership is still the American Dream.
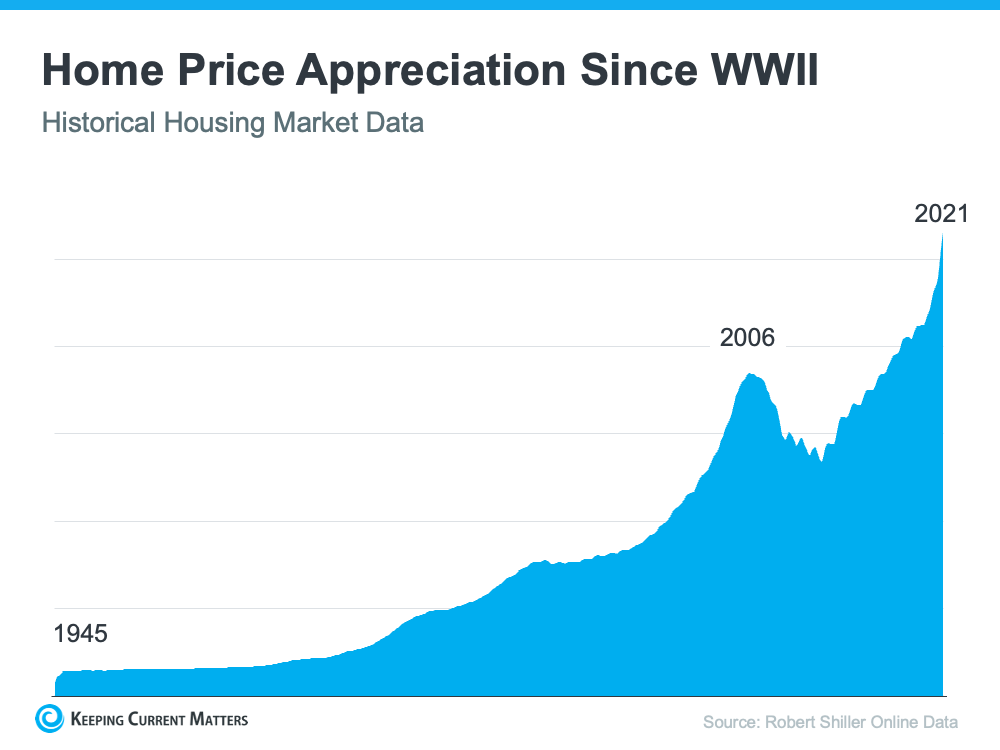
Prior to the 1950s, less than half of the country owned their own home. However, after World War II, many returning veterans used the benefits afforded by the GI Bill to purchase a home. Since then, the percentage of homeowners throughout the country has increased to the current rate of 65.5%. That strong desire for homeownership has kept home values appreciating ever since. The graph below tracks home price appreciation since the end of World War II:
 (more…)
One of the major story lines over the last year is how well the residential real estate market performed, with home prices are skyrocketing this year.
This article from Keeping Current Matters shows that prices have been rising across the country and at all price points, while expert forecasts call for price increases of 5-8% in 2022. The article concludes “If you’re thinking of buying, consider buying now as prices are forecast to continue increasing through at least next year.”
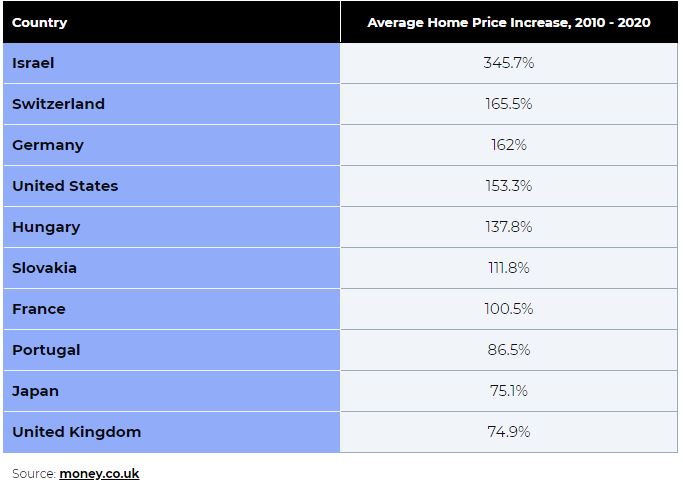
According to data gathered by money.co.uk (no relation to money.com, but we should probably be friends or something), the country with the highest property price increase from 2010 to 2020 was Israel, where there was a staggering 346% rise in costs per square meter.
Switzerland and Germany come next, with increases of 166% and 162%, followed by the United States at 153%. Hungary, Slovakia, France, Portugal, Japan and the United Kingdom round out the rest of the top 10, all with average home price increases of at least 75%.
 (more…)
Today’s market problems – a shortage of affordable housing, historically tight inventory of homes for sale and rising prices – weren’t caused by the latest pandemic-caused economic slowdown. It goes back to the Great Recession.
Experts say the U.S. housing market was already being roiled by forces fueling the current housing-price explosion even before the pandemic.
Matthew Murphy at New York University’s Furman Center for Real Estate & Urban Policy said supply shortages were evident heading into the pandemic, adding that “the context here to this current housing moment is that we were still recovering from the 2008-2009 foreclosure crisis.”
Meanwhile, the National Association of Realtors® has been pointing to an “underbuilding gap” of between 5.5 and 6.8 million housing units since 2001. (more…)
Manhattan real estate prices reached an all-time high in the second quarter, as buyers returned to the city and boosted demand for the largest, most expensive apartments, according to new reports.
The median resale price for Manhattan apartments hit $999,000 in the second quarter — the highest on record, according to a report from Douglas Elliman and Miller Samuel. Average sale prices rose 12% in the quarter, topping $1.9 million.

The price jumps and shrinking inventory suggest the Manhattan real estate rebound continues to gain momentum, as more families look to trade up to larger apartments and buyers look to take advantage of lower prices and low mortgage rates.
“It’s a sign of the frenzy and intensity of the market,” said Jonathan Miller, CEO of real estate appraisal firm Miller Samuel. “It’s rebounding much faster than most participants expected.” (more…)
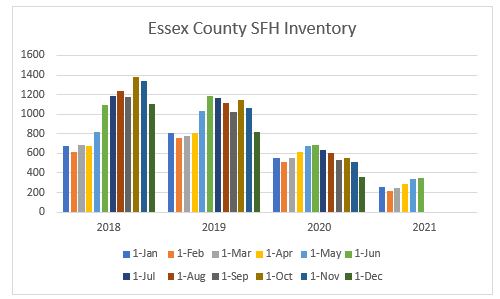
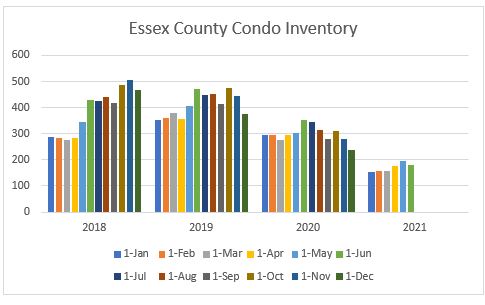
Housing inventory for the 34 cities and towns of Essex County in pictures:
Single Family Homes
Condos
Mortgage rates
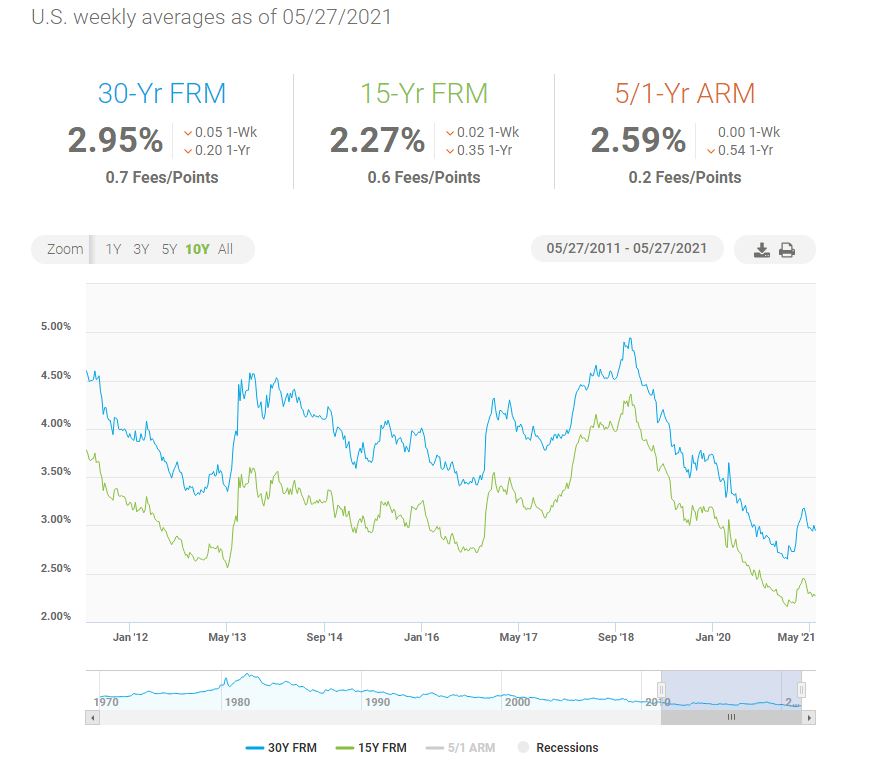
After moving up for several weeks the 30-year Fixed rate Mortgage dropped blow 3% again. Note how cheap 15-year mortgages are for those who can afford the extra payment.
Comment (more…)


Recent Comments