Bidding Wars return to the North Shore
One of the features of the housing market boom of 2020-2022 was the very high number of sales above list price, an indication that there were multiple offers resulting in bidding wars.
And a logical consequence of the market returning to more normal conditions would be to expect a decline in bidding wars, leading to fewer sales taking place above list price.
Has this actually happened?
Let’s look at the sales in last 12 months in Marblehead, Swampscott and Salem. Here is the chart: (more…)
Harvard Students share their Vision for Lynn
Students from the Harvard Graduate School of Design presented their semester-long group projects based on the theme of “Lynn: A Greater Gateway” at the Lynn Museum Thursday evening.
“We’ve been working with the city since January to think about what does it mean to be a gateway city,” project coordinator and Associate Professor Dan D’Oca said.

Each group looked at different topics, including economic development and transportation, and thought of how to tailor the city to recent immigrants.
Graduate student Aathira Pillai’s group proposed developing an app for the city’s residents.
“Individuals can come together on one platform [and] start pulling things in, that is where we propose ‘My Lynn’ app,” Pillai said.
The app would be able to function in whatever language the user needs, she said.
“Apart from helping you reach the critical resources that you might need, you might also walk around, scan through the app and get all the city posters, signs, instructions translated to something that you are comfortable with,” Pillai said.
Another proposal came from Briana Villavarde’s group, which focused on an urban heating resilience plan.
“What it really goes over is that technical solutions to urban heat are usually inequitably distributed throughout the city,” Villavarde said. “So how can community engagement, and local and oral knowledge from residents really make technical solutions more robust [in] addressing where heat is the most severe and really targeting vulnerable populations first.”
Through her research she found hot spots in the city, some of which are the General Electric plant, Market Basket, and downtown Lynn.
Other proposals discussed issues such as flooding, equitable development, and affordable housing.
Developer Charlie Patsios of Swampscott said he was “impressed” by the projects he saw from the students Thursday evening.
“What they’re doing is they’re envisioning everything, but they’re asking questions of me on what can happen, and what permission we can give them to let them look at all possibilities,” Patsios said.
“It’s been amazing, the students love the city,” D’Oca said. “Everybody we talked to has been really generous with their time and people have given us a lot of feedback. It’s a place that people really seem to love, we totally get why, and so we hope we did it justice with some of these recommendations we made.” (The Daily Item)
And these recent articles: (more…)
Q1 2023 Market Stats
Q1 2023 Market Stats for selected towns (stats for other towns in Essex County are available on request)
Amesbury Q1
Beverly Q1
Gloucester Q1
Marblehead Q1
Salem Q1
Swampscott Q1
And these recent articles: (more…)
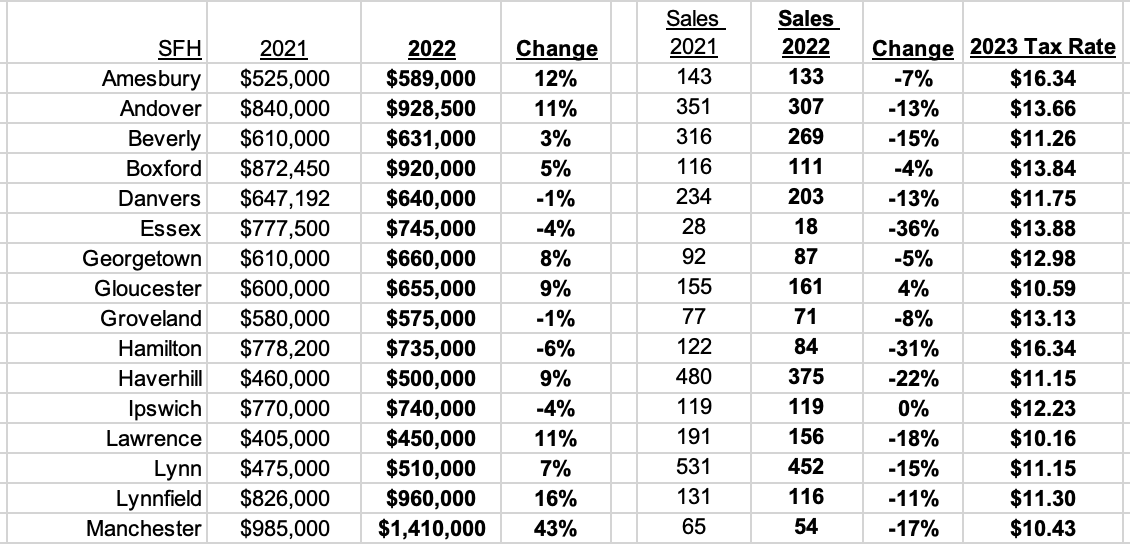
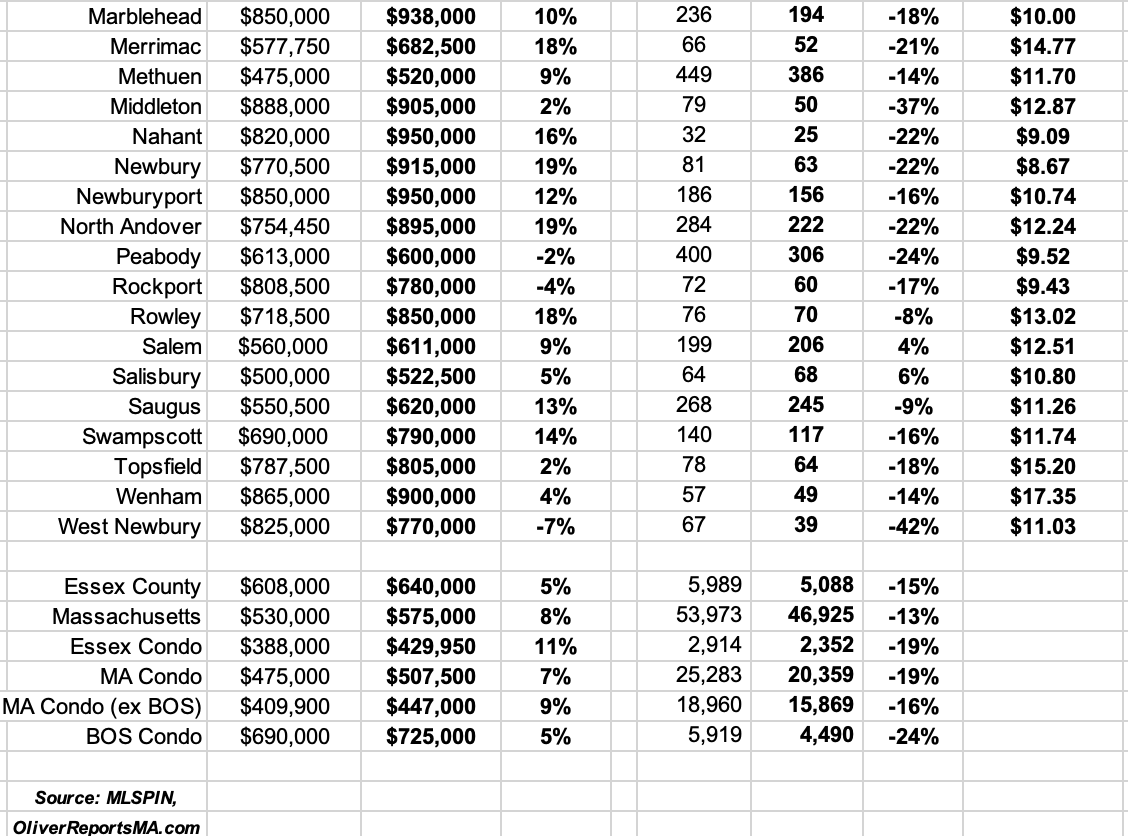
Essex County Town by Town Guide: 2022 Median Prices and Sales; 2023 Tax Rates
Here is a town-by-town guide to 2022 Median Prices and Sales, together with 2023 property tax rates.
Read February Inventory as low as this weekend’s temperature
And these recent articles:
Economic and mortgage commentary
How Marblehead’s 2023 Property Tax Rate is Calculated
Essex County 2023 Property Tax Rates: Town by Town guide
Lies, Damned Lies and Inflation “Statistics”* (more…)
List of currently available properties
New listings are seeing tremendous competition, and inventory is way down compared with a year ago. Buyers need to look at the list of all available properties as sometimes properties get overlooked for no obvious reason. Here is the summary of current inventory: (more…)
How did North Shore Home Prices Perform in the last Decade?
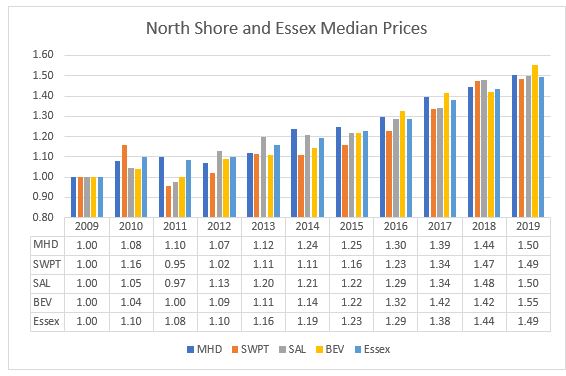
The decade from 2010-2019 saw a remarkably consistent record of Single Family Home Price increases throughout the North Shore and Essex County.
For the purposes of comparison I have converted all prices to a base of 100 for 2009.
The first chart shows the performance of Marblehead, Swampscott, Salem, Beverly and Essex County as a whole. If you look at the numbers for 2019 you can see how consistent the performance was, with a 50% increase over the decade.
 (more…)
New Nahant Magazine
Click Nahant to read a digital copy of this new magazine covering Nahant.
Check out the Q&A with Dick and Matt on page 3.
Andrew Oliver
Market Analyst | Team Harborside | teamharborside.com
REALTOR®
Sagan Harborside Sotheby’s International Realty
One Essex Street | Marblehead, MA 01945
m 617.834.8205
www.OliverReports.com
www.TeamHarborside.com
Andrew.Oliver@SothebysRealty.com
Sotheby’s International Realty® is a registered trademark licensed to Sotheby’s International Realty Affiliates LLC. Each Office Is Independently Owned and Operated
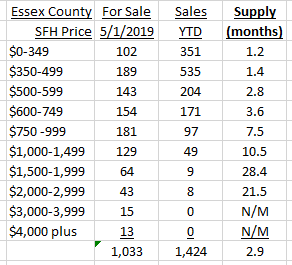
Housing Inventory by Price in North Shore towns
While conventional wisdom holds that a market is in equilibrium between buyers and sellers when the current inventory represents 6 months of sales, that overall number masks major differences which occur at different price points.
The tables below show the position by price for Essex County overall and for Marblehead, Swampscott, Salem, Beverly and Lynn.
Essex County
The table below breaks down supply at different price levels for Essex County overall.This shows that the dynamic between sellers and buyers changes as prices go above $750,000.
Huge jump in Mortgage Loan Limits
Home buyers in Essex County and Suffolk County received a major boost this week with the announcement that the limit for conforming mortgages was being increased by 18% from $523,250 to $598,000.
For a buyer putting down 20% the price of a home that can be financed conventionally – meaning that it can be sold to Fannie Mae or Freddie Mac – jumps by almost $100,000, from $654,063 to $747,500.
This table shows the trend in the last few years: (more…)
Time to think outside Marblehead Neck
You would like to buy a house on the water, but you have noticed the amount of traffic on the Neck and are concerned with exposure to storms.
So what to do?
The answer is: think outside the Neck.
Read Marblehead’s Unknown Oceanfromt properties and you may be surprised to learn that between Preston Beach and Beach Street there are 32 homes (and likely a few more when the FY2016 assessments are announced in December as this area is appreciating) with an Assessed Value over $2 million.
Two of these properties are currently for sale and details can be seen by clicking on 11 Crown Way and 2-4 Coolidge Road.
Crown Way has an Open House today 1-3 and both house will be open next Sunday (if not sold before then).
The week’s new listings
This week saw a similar number of new listings to last week: (more…)



Recent Comments