Accepted Offers: the Curve is Flattening
The best current indicator of market activity I can find is the number of properties receiving accepted offers week by week.
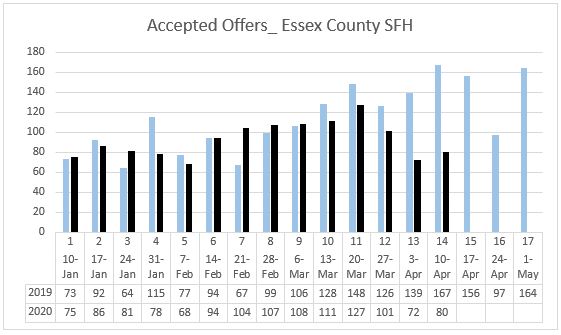
This chart compares the number of SFHs receiving accepted offers week by week in 2019 and 2020 in the 34 cities and towns of Essex County (I have used Essex County to get a large enough sample to be significant.)

For the first 9 weeks of the year – through March 6, 2020 (March 8, 2019) – the number of accepted offers was slightly ahead in 2020: averaging 91 vs 87 in 2019.
The number of accepted offers then started to drop: by 17, 19, 25, 67 and this past week by 87. But the actual number of Accepted Offers saw a small increase from the previous week.
The curve is flattening
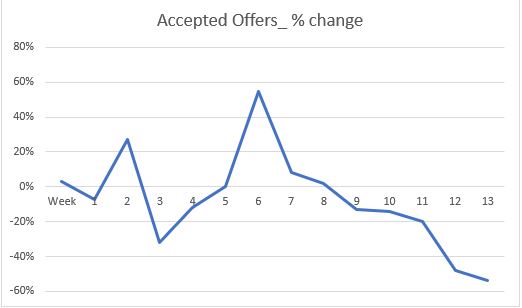
We have learned to be on the lookout for the flattening of the curve with COVID_19 so let’s apply the same technique to the housing market. This chart shows the percentage change each week compared with 2019:

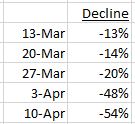
This is the change in the last few weeks:

While this last week showed a slightly larger decline than the week before, the pace of decline has slowed – or flattened. Bear in mind, this was Holy Week and if you look at the first table, week 16 in 2019 – which was Holy Week – saw an almost 40% drop from the week before.
Outlook
April traditionally sees an uptick in market activity – the “spring market”. In 2019, the weekly average – even allowing for the drop in Holy Week – in the four full weeks of April was 146 accepted offers.
Adding to the economic uncertainty is the challenge of viewing properties, but we are rapidly developing a new norm for the process as buyers and sellers adapt.
It seems likely that the number of accepted offers will continue to trail below last year’s levels, but properties are still selling. It will be instructive to see if the level of activity picks up as cash from the many stimulus programs starts to arrive.
While activity will drop, it is not clear what the impact will be on prices. I suspect that will be a case-by-case situation depending upon the specific circumstances of sellers. Essex County is largely a first home – meaning primary residence – market. Contrast that with Naples, Florida – a second or vacation home market, where 65% of properties which went under agreement in the last 3 weeks have come back on to the market.
As with the economy at large, the housing market entered this shutdown from a position of strength: a chronic shortage of supply and low mortgage rates. The best outcome might be a resetting of the supply/demand imbalance creating a stable market.
A Calmer Mortgage Market
Recession and Recovery
Andrew Oliver
Market Analyst | Team Harborside | teamharborside.com
REALTOR®
Sagan Harborside Sotheby’s International Realty
One Essex Street | Marblehead, MA 01945
m 617.834.8205
www.OliverReports.com
Andrew.Oliver@SothebysRealty.com
Sotheby’s International Realty® is a registered trademark licensed to Sotheby’s International Realty Affiliates LLC. Each Office Is Independently Owned and Operated
