
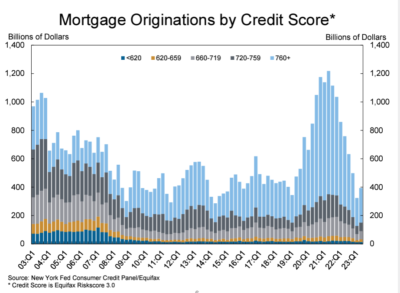
Two More Ways the Mortgage Market differs from 2007/2008
The chart below shows how loans with a credit score under 660 – the bottom colours of yellow and dark blue – which were about 20% of the total in the 2004-2007 period, have virtually ceased, with loans over 720 now making up the vast majority of new mortgages.
Two other changes:
Adjustable-rate mortgages can lead to higher default rates when interest rates rise, but they now represent less than 5% of total purchase and refinance loans, compared with over 35% at the peak of the pre-GFC (Global Financial Crisis) housing cycle. (FORTUNE)
The ratio of Americans’ mortgage debt to their real estate assets—also called loan-to-value—was just 27% in the second quarter, compared to over 40% in 2008 and roughly 50% in 2010. (Bank of America)
And these recent articles:
Core Inflation Prices Barely Budged in August
Two More Ways the Mortgage Market differs from 2007/2008
October Inventory shows Sharp Jump from September
Credit Score Change Could Help Millions of Buyers (more…)
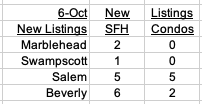
New Listings mid-week October 11
Here are the latest New Listings:
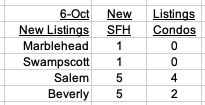
Click on these links for details:
Marblehead New Listings
Swampscott New Listings
Salem New Listings
Beverly New Listings
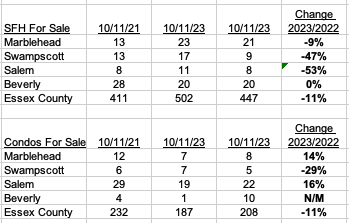
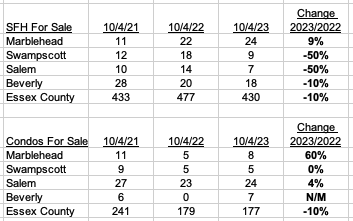
Here are the latest inventory numbers:
And these recent articles:
Core Inflation Prices Barely Budged in August
Two More Ways the Mortgage Market differs from 2007/2008
October Inventory shows Sharp Jump from September
Credit Score Change Could Help Millions of Buyers (more…)
Open Houses Sunday October 7
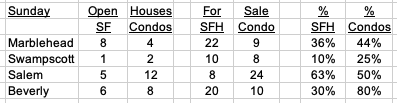
Here are today’s Open Houses:
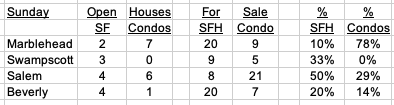
Click on these links for details:
Marblehead Open Houses
Swampscott Open Houses
Salem Open Houses
Beverly Open House
And read these recent articles:
Core Inflation Prices Barely Budged in August
October Inventory shows Sharp Jump from September</a.
Credit Score Change Could Help Millions of Buyers
August Sales still mostly over List Price
2023 Sales Continue Strongly over List Price (more…)
New Listings week ending October 6
Here are the latest New Listings:
Click on these links for details:
Marblehead New Listings
Swampscott New Listings
Salem New Listings
Beverly New Listings
Here are the latest inventory numbers:
And these recent articles:
Core Inflation Prices Barely Budged in August
October Inventory shows Sharp Jump from September
Credit Score Change Could Help Millions of Buyers (more…)
Open Houses weekend October7/8
Here are this weekend’s Open Houses (an updated list for Sunday will be posted tomorrow at 8 a.m.*):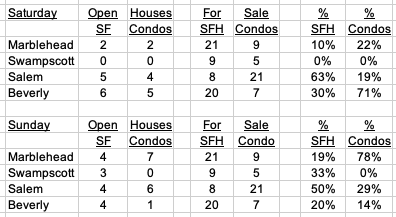
Click on these links for details:
Marblehead Open Houses
Swampscott Open Houses
Salem Open Houses
Beverly Open House
*due to the timing of the MLS feed many of Sunday’s OHs do not show up in today’s links until later today and will be in tomorrow’s post
And read these recent articles:
Core Inflation Prices Barely Budged in August
October Inventory shows Sharp Jump from September Credit Score Change Could Help Millions of Buyers
August Sales still mostly over List Price
2023 Sales Continue Strongly over List Price (more…)
New Listings mid-week October 4
Here are the latest New Listings:
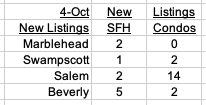
Click on these links for details:
Marblehead New Listings
Swampscott New Listings
Salem New Listings
Beverly New Listings
Here are the latest inventory numbers:
And these recent articles:
Core Inflation Prices Barely Budged in August
October Inventory shows Sharp Jump from September
Credit Score Change Could Help Millions of Buyers (more…)
Open Houses October 1
Here are today’s Open Houses:
Click on these links for details:
Marblehead Open Houses
Swampscott Open Houses
Salem Open Houses
Beverly Open House
And read these recent articles:
Core Inflation Prices Barely Budged in August
Credit Score Change Could Help Millions of Buyers
August Sales still mostly over List Price
2023 Sales Continue Strongly over List Price
No signs of improvement in September Housing Inventory (more…)
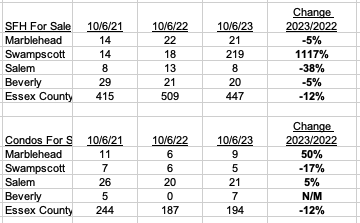
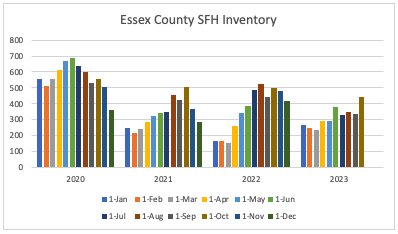
October Inventory shows Sharp Jump from September
Overall Inventory in Essex County has been on a roller-coaster this year in terms of comparison with a year ago.
Single Family Homes (SFH)
In the early months SFH was up 50% or more from the extremely low levels in 2022. By the summer, YOY inventory was down by around 1/3. October showed an increase of 1/3 from September 1, bringing the YOY deficit to just 11%.
Condos
Condo inventory showed a similar, if less exaggerated, pattern. The 45% increase from September to October brought inventory levels in line with 2022’s, but still well below those in 2020 and 2021.
(more…)
Recent Comments