Marblehead: 2017 Housing Market sets another record
(Click here to download a pdf of this report.)
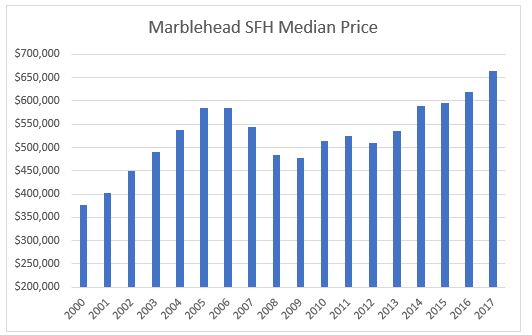
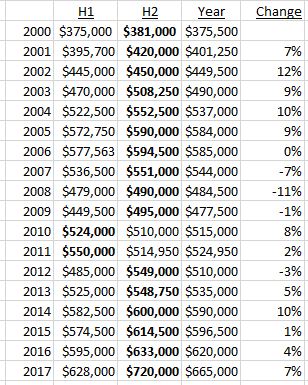
In 2017 the median price of the Single Family Homes (SFH) sold in Marblehead increased by $45,000, or 7%, to $665,000, a new record high for the fourth year in a row. As in every year since 2000 except 2010 and 2011, the median price was higher in the second half of the year than in the first half, breaching $700,000 for the first time.
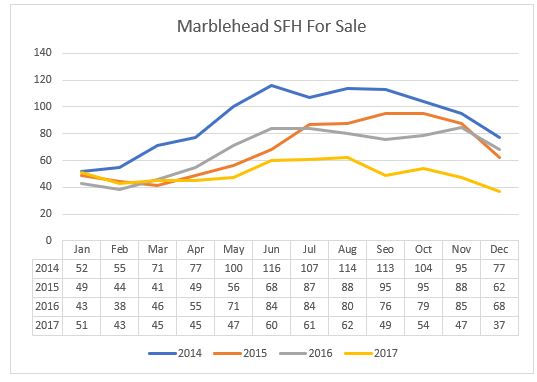
Sales were down only modestly, despite the low inventory all year, while the number of SFHs for sale on average dropped about 25% from the levels of the two prior years, and by 45% compared with 2014.
It is important to bear in mind that only around 4% of Marblehead’s more than 6,200 SFHs change hands publicly in any year, but 4% is a reasonable sample, with sales taking place from $290,000 to $5.8 million.
Median price
The first chart shows median prices since 2000. I find it helpful to look at longer term trends and this chart shows how prices – which had already risen for some years prior to 2000 – jumped sharply in the early years of the millennium, dropped during the Great Recession, recovered, and have now hit new highs for the last 4 years. Below the chart is a table of prices since 2000.
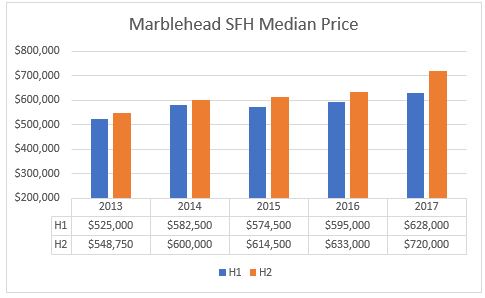
The second chart shows the median price for the two halves of the year and for the full year for the last 5 years. The second half of 2017 saw a significant upward movement.
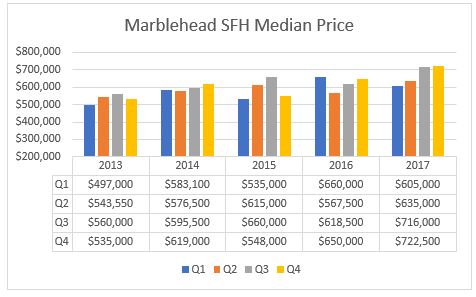
The next chart shows how the market can vary from quarter to quarter. In the last 5 years the highest quarterly median price has been recorded once in Q1 and twice each in Q3 and Q4.
 Sales
Sales
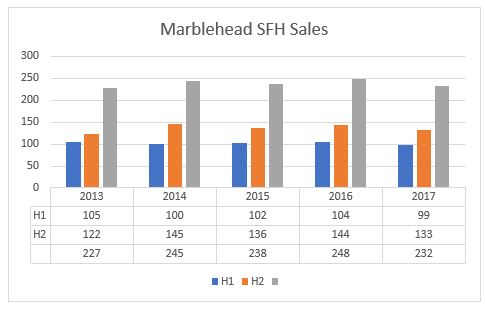
Despite all the (accurate) stories of the lack of inventory throughout 2017 sales were down quite modestly and have been more or less flat for the last 5 years, recovering from the slump of the Great Recession, but still not back to the levels of the peak years. There is no doubt that lack of supply has been holding back sales.
Sales by price
The table shows the breakdown in sales by price for the last four years.
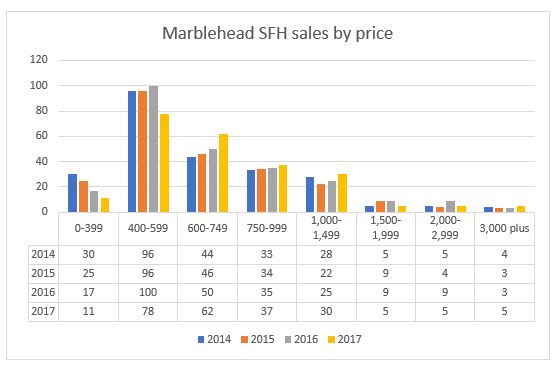 Within basically flat total sales there have been major shifts. 2017 saw a sharp drop in sales in the $4-600,000 range, while sales increased in all brackets from $600,000-$1.5 million. 2017 also saw 2 sales at $5.8 million, the highest ever recorded in MLS.
Houses For Sale
The seasonality of the number of houses for sale largely disappeared in 2017 – the traditional spring pick-up in inventory failed to materialize. The fact that total sales were down only slightly despite the low inventory implies that houses were generally selling more quickly than in prior years.
We start 2018 with just 24 SFHs for sale and 15 of those are above $1 million. The cheapest SFH listed is $519,000 and there are just 3 under $700,000.
Assessed Value to Sales Ratio (ASR)
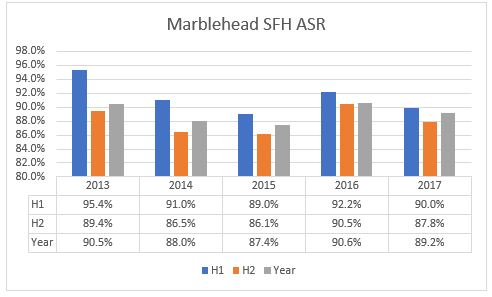
One way I measure prices is by the ratio (ASR) of Assessed Value (AV) to Sales Price (SP). The ASR is the AV divided by the SP: if the SP is rising (prices going up), the ASR will fall. In a period of rising prices the ASR is likely, as a lagging indicator, to be below 100%.
As we hope out properties are worth more than the AV an ASR below 100% is a positive sign. Remember that AVs are a lagging indicator: the tax bills that have just been sent out for FY2018 are based on actual sales in 2016. Thus the 2017 sales data, reported in this review, will be the basis for FY2019 assessments. And my data compares 2017 sales with AVs based upon 2016 prices.
Let’s look at the ASR in recent years:
For the last 4 years the ASR has been around 90% or below, indicating that the median sale has been taken place at about a 10% premium to Assessed Value, despite the increases in Assessed Values.
Outlook for 2018
Immediately after the 2016 Election I published What does the Election mean for real estate markets? in which I made the bullish case: “The removal of a lot of strangling regulations and the end of gridlock in Congress will produce stronger economic growth. Major infrastructure spending will boost jobs and wages at the lower end, while lower corporate tax rates and lower personal tax rates will produce increased personal wealth. Interest rates will rise, reflecting the stronger economy, and the demand for housing will increase. Greater wealth and confidence will provide a boost to the higher end of the market.” I concluded:”I have no doubt that 2017 will provide many surprises along the way, but with a stronger economy and low supply of houses for sale, there seems little reason for home prices in Marblehead not to continue their steady, but modest, upward movement.”
Um, well we got many surprises…..and some of the economic progress, and prices increased perhaps more than modestly. As for 2018? There are a lot of variables, particularly as people in States like Massachusetts try to figure out how they come out with the tax changes. The economy may well grow at a faster rate than in recent years, which would place upward pressure on interest rates and mortgage rates, while it is hard to see at this stage what will increase the supply of houses for sale.
Andrew Oliver
www.OliverReports.com

