Mortgage rates are rising – and that’s good news
The difficulty in forecasting in these extraordinary times was demonstrated on Friday when the latest employment report showed an increase of 2.5 million jobs versus the forecast of a decline of 7.5 million – a 10 million difference! As HSH.com said in its weekly report: “Months and years from now, it will probably become very clear that April 2020 was the absolute depth of the COVID-19 pandemic recession. That’s not to say that we’ve moved to a place of recovery, or that nascent “green shoots” are necessarily a harbinger of a swift return to a fully-fledged economy; we haven’t, and they’re not. However, it could be said that we’re starting to move to a less-deep place of recession and that important signals about an eventual return to growth are starting to be seen.”
The vast amount of liquidity the Federal reserve has pumped into the economy continues to fuel a booming stock market and Friday’s report produced another 3% gain. The S&P 500 is now down just 1% for the year (after falling 30% earlier), while the NASDAQ, which fell 25% earlier, is not up 9% for the year.
The Fed has rescued the market again.
What does this mean for mortgage rates?
First, I will explain the link – or lack of link – between FF and FRM – and what actually drives mortgage rates. This is easier than predicting what will happen going forward, but for what it is worth I offer some thoughts at the end of this piece.
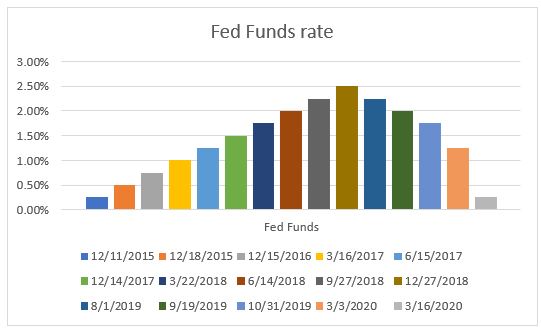
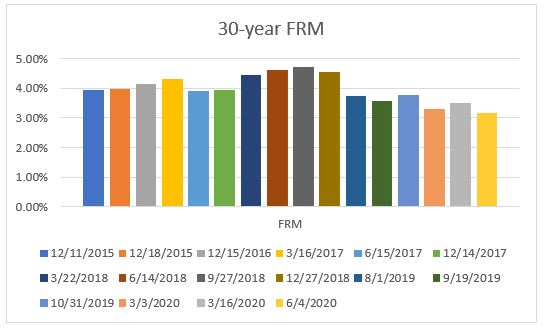
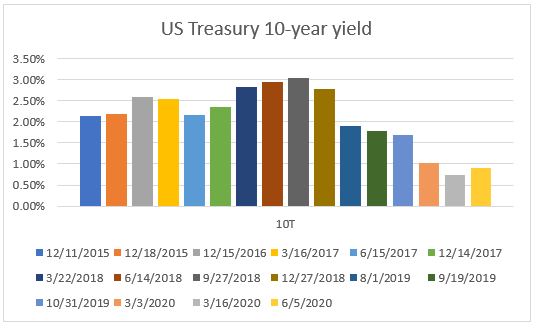
Five charts explain the factors driving mortgage rates. In all cases the numbers are at the dates that the Fed has changed its FF over the last 4 years: 10 increases, followed by four decreases.
Fed Funds rate (FF)
The Fed Fund rate is the rate at which banks lend to each other overnight.
After increasing from 0% to 2.5% since late 2015, cuts in 2019 and 2020 have lowered the rate back down to 0.25%, following the dramatic and proactive cuts in March.
30-year Fixed Rate Mortgage (FRM)
The FRM reached nearly 5% in late 2018 and dropped to an all-time low of 3.15% in late May.
10-year Treasury yield (10T)
The yield on the 10T is influenced by two major factors: the outlook for the economy (expanding businesses invest creating demand for money) and geopolitical events – the US dollar and US Treasuries are seen as a safe haven during times of uncertainty.
The yield reached 3.2% in November, 2018 (which was the time of the peak in the FRM), eased back under 2% in 2019 and then plummeted from 1.88% in early 2020 to just 0.58% in late April. It stayed in the 0.6-0.7% % range until this week, when the yield increased to Friday’ 0.91% following the employent report.
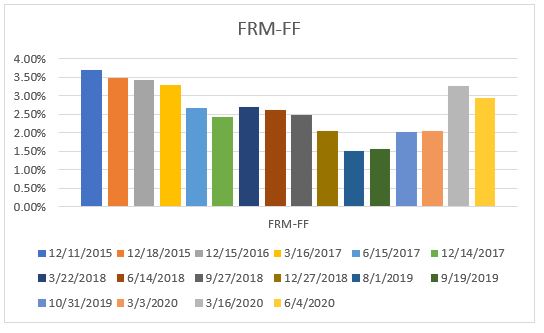
The spread, or difference, between FRM and FF
If there were a link between FF and FRM it would show up in this chart. In fact, the spread dropped from 3.7% in 2015 to 1.5% in 2019 before increasing to 3.0% recently, demonstrating that there is no direct link between FF and FRM
The spread, or difference, between FRM and 10T
We see more consistency between FRM and 10T, where the spread was in a much tighter range of 1.5% to 1.8% until the second half of 2019 and into 2020.
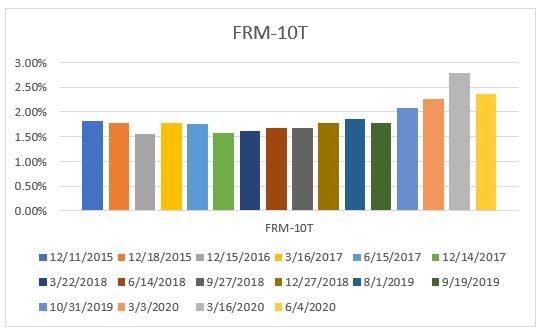
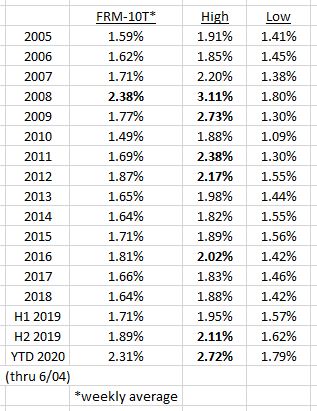
Indeed, over the last several years the spread between FRM and 10T has been very stable averaging around 1.7%. But I would point out two things in this table: first, the spread widened significantly in the Great Recession in 2008; and, secondly, while the median spread for the year has been in a narrow range, within the years there have been quite wide variations – in particular look at 2008/2009 and again in 2020 where the spread has ranged from 1.8% to 2.7% – well above historic levels.
Comment
The FF rate affects the lending rate for credit cards, auto loans, adjustable rate mortgages, all of which are impacted by banks’ Prime Rates, which moves with the FF rate. Fixed Rate Mortgages – the typical 30-year mortgage – have a longer life and their benchmark is the closest Treasury security, which is the 10T. Conventional mortgages are bundled and sold to investors, who require a risk premium – higher yield – over that offered by 10T.
As can be seen, that premium – spread – has been remarkable constant over recent years. It does fluctuate from time to time as the yield on 10T tends to move quickly at times – as we have seen this year – but in recent years it always comes back to around that 1.7% level.
Here are a few thoughts about the current situation:
1. As HSH has pointed out, April 2020 will likely be seen as the nadir of the COVID-19 recession and the depth and speed of the plunge mean that comparing numbers from the absolute lows will show big percentage increases – but the absolute levels will look bad for some time to come. For example, the employment numbers showed 10 million more jobs than forecast – but the unemployment rate was still over 13% and was nearly 17% for African American workers.
2. It will not be known for some time how many business will not reopen or how many furloughed workers will face unemployment when their employers go out of business.
3. The country faces a consistent demand that it is time to do more than talk about the racism that still exists in so many ways. It is encouraging that so many major corporations have spoken our in recent weeks about the plans they are making to contribute to – and lead the way to – a more just society, And major groups in non-business areas are also speaking up and out – witness the NFL this week.
Mortgage rates
As the last table showed, whereas over time the spread between FRM and 10T has been consistent in the 1.7% range, there have been wide variations in the short-term. We saw that in 2008 and 2009, a time of great economic duress when widespread buying of US Treasuries as a safe haven drove yields down and spreads widened. Those spreads returned to the norm as economic conditions improved.
The current economic situation is very different from the Great Recession. Indeed, but for COVID-19 the strength of the economy earlier in the year would have lead to expectations that the Fed would be increasing rates, rather than the dramatic cuts we saw.
Another factor is the demand for mortgage-backed securities (MBS), the bundles of mortgages sold to investors. In the Great Recession, investors were wary about the value of the underlying security – residential mortgages – and so demanded a larger premium.
Part of the reason that mortgage rates spiked initially in March was that investors stopped buying MBS as they were uncertain about the impact forbearance plans would have on mortgage interest payments. The MBS market recovered when the Fed stepped in as a buyer, but the uncertainties remain, leaving the Fed as the largest buyer of MBS.
In normal times I tell people to add 1.7% to the 10T yield to get an idea of where the FRM should be. But in 2008/09 and again in 2020 that formula is thrown off by extraordinary events whether it be the Great Recession or COVID-19.
The reason that the rise in interest rates this week is good news is that it is an indication that markets are at least starting to return to normal. We are not going to see mortgage rates fall into line with the 10T + 1.7% formula (implying a FRM of 2.6%) because in times of economic stress the formula changes slightly to 10T +1.7% + a risk premium.
What we have seen is the start of a move, which may well be a longer-term trend, of people moving out of cities into the suburbs into larger houses with more open space around them (see artilce below). This is adding demand (from people selling higher-priced properties so more willing possibly to pay up) to a market suffering – in Essex County – from a 40% reduction in inventory compared with a year ago – when inventory was low anyway.
In summary, I would say that FRM rates in the 3 1/4% range may well be the low point in this cycle. And that is an extrmeley attractive rate.
Goodbye Boston, Hello Marblehead
Accepted Offers held back by shortage of inventory
Are mortgage rates headed to 3%?
“If you’re interested in Marblehead, you have to visit the blog of Mr. Andrew Oliver, author and curator of OliverReports.com. He’s assembled the most comprehensive analysis of Essex County we know of with market data and trends going back decades. It’s a great starting point for those looking in the towns of Marblehead, Sale, Beverly, Lynn and Swampscott.”
Andrew Oliver
REALTOR®
Sagan Harborside Sotheby’s International Realty
One Essex Street | Marblehead, MA 01945
m 617.834.8205
www.OliverReports.com
www.TeamHarborside.com
Andrew.Oliver@SothebysRealty.com
Sotheby’s International Realty® is a registered trademark licensed to Sotheby’s International Realty Affiliates LLC. Each Office Is Independently Owned and Operated
