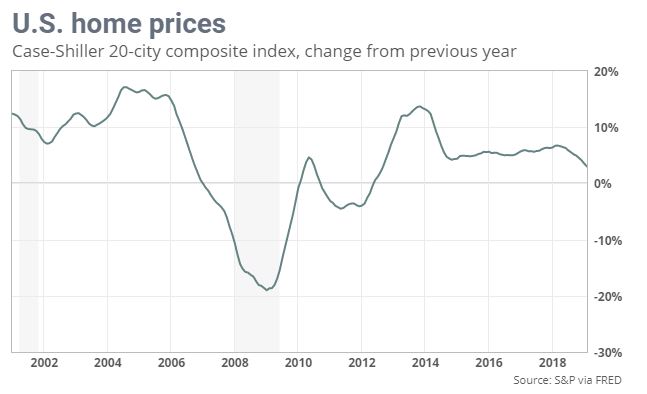
“Home price growth screeches to a 6 1/2-year low”
“Home price growth screeches to a 6 1/2-year low, Case-Shiller says,” was the headline in a report about the latest Case-Shiller 20 City Index which showed that the rate of increase in February was marginally less than in January. The article started: “National home price appreciation has thudded back to earth.”
Wow, what catastrophe has occurred?
Well, none actually.
First, let’s look at the chart showing the rate of annual increases. And note this is just for the 20 Cities in this Index.

Yes, the rate of increase did decline slightly, but prices are still going up. The next chart shows the actual index level rather than the rate of increase:
Comment
The S&P Case-Shiller Index, or rather series of indexes, is the most well-known and most frequently used source for information about housing price movement. But headlines and opening sentences such as the one quoted here are either simply seeking attention or written by somebody with little understanding of math.
The key point here is that while the rate of increase may be slowing, prices nationally are still rising. And by the way the full National Index increased 4% in February from a year ago (Year-on-Year or YOY) which was slightly less than the 4.2% in January.
Let’s put that into perspective. A $500,000 house which increases 4.2% becomes a $521,000 house; but if the rate of increase “screeches” down to 4%, the price is only $520,000. Really.
And that is still $20,000 more expensive to buy that it would have been one year earlier.
There are many, many factors to consider when buying a house: family needs and schools are two obvious ones. Being aware of national trends, both in terms of the economy and in home price movements, is an important piece of data, but it is just one of many, but it is also important to be able to look beyond the noise to what is really happening.
