The Facts about Inventory and Home Prices
Confused by the market? Is inventory on the increase? What about sales? Are New Listings down? And how can sales be steady if inventory is down so much, especially when compared with 2019?
Let’s try to address these questions.
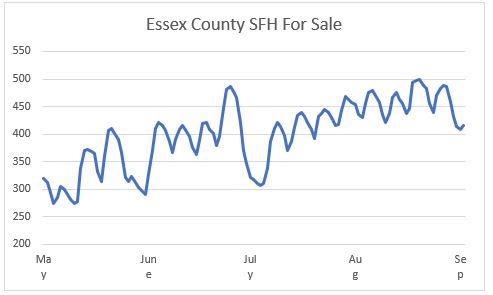
Is inventory on the increase? This chart shows the daily SFH active inventory for Essex County.There was an interesting phenomenon at the end of June. The SF inventory dropped from 477 on June 24 to 315 on July 2. My guess is there were two factors at work- buyers wanting to get an offer accepted before July 4 – and sellers waiting until after that date to list.
There has also been a drop throughout August which may reflect sellers waiting until Labor Day to list.

What is happening to Sales?
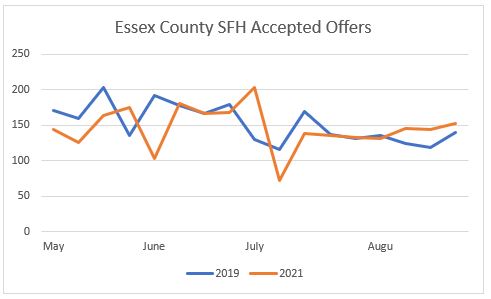
After the slowdown in sales in the spring of 2020 activity really picked up in the following months. I have therefore looked at the number of offers being accepted each week (Accepted Offers) for the summer of 2021 and compared the results with 2019. If one excludes the shenanigans around July 4th, the number of AO each week has been steady to rising slightly since then.

New Listings
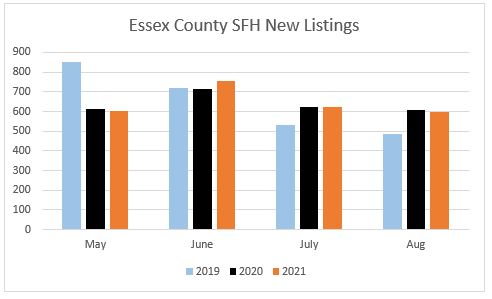
While there were more New Listings in May in 2019 than in 2020 or 2021, the overall totals for the 4 months were almost identical:

Median Prices
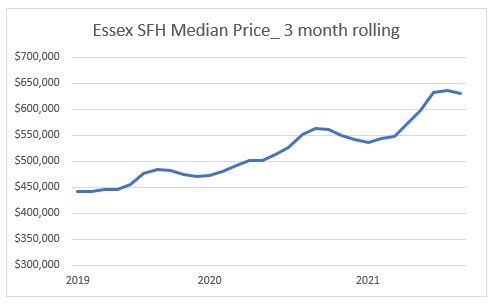
I prefer to look at prices on a quarterly basis and compare year with year to eliminate seasonal influences. On this occasion, I have taken monthly SFH median prices and then charted them on a 3-month rolling basis. Prices have risen sharply and are showing a similar shape year=to-year, although the upward slope in the first half og 2021 was much more steep.

Comment
The summer is ending with sadly still a lot of uncertainty about the impact the Delta strain of COVID will have on the economy, which has demonstrated some signs of slowing recently. As it has been for most of our lives the last 18 months, COVID will continue to have a major influence on both the economy and the housing market.
It does seem, however, that working from home is likely to continue in some form and become a permanent feature of the economy. While we may have seen the peak of the flight out of cities, there is no reason to believe that the trend will reverse.
And read these recent articles:
Team Harborside recognized on America’s Best Real Estate Professionals list
Are mortgage rates heading up or down?
Essex County 2021 Residential Property Tax Rates: a Town by Town guide
Naples market summary in June
If you – or somebody you know – are considering buying or selling a home and have questions about the market and/or current home prices, please contact me on 617.834.8205 or Andrew.Oliver@SothebysRealty.com.
“If you’re interested in Marblehead, you have to visit the blog of Mr. Andrew Oliver, author and curator of Oliver Reports . He’s assembled the most comprehensive analysis of Essex County we know of with market data and trends going back decades. It’s a great starting point for those looking in the towns of Marblehead, Sale, Beverly, Lynn and Swampscott.”
Andrew Oliver
Market Analyst | Team Harborside | teamharborside.com
REALTOR®
Sagan Harborside Sotheby’s International Realty
One Essex Street | Marblehead, MA 01945
m 617.834.8205
www.OliverReportsMA.com
Andrew.Oliver@SothebysRealty.com
Sotheby’s International Realty® is a registered trademark licensed to Sotheby’s International Realty Affiliates LLC. Each Office Is Independently Owned and Operated
Andrew Oliver
Sales Associate | Market Analyst | DomainRealty.com
REALTOR®
Naples, Bonita Springs and Fort Myers
Andrew.Oliver@DomainRealtySales.com
m. 617.834.8205
www.MarbleheadSouth.com
