Mid-April Is Prime Time for Sales
Sellers nationwide will likely see the best conditions for listing prices, buyer demand and sales pace from April 14 to April 20, making it the best time to sell, Realtor.com said.
Realtor.com detailed why the April time period is the best time to sell:
Above-average prices – The prices of homes listed during this week have historically been 1.1% higher than the average week and are typically 10.4% higher than at the start of the year. If 2024 follows last year’s seasonal trend, the national median listing price could be $7,400 higher than the average week, and $34,000 more than at the start of the year.
Above-average buyer demand – The more buyers looking at homes, the better it is for offers and sales. Historically, this week saw 18.4% more views per listing than the typical week, but in 2023 this week got 22.8% more views per listing than the average week during the year. Demand will in part depend on mortgage rates – falling rates may increase spring demand, while steady or rising rates may prompt some buyers to hold off.
Faster market pace – Thanks to above-average demand, homes tend to sell more quickly during this week. Historically, homes actively for sale during the week of April 14 sold 17%, or about 9 days, faster than in the average week. In 2023, this week typically saw homes on the market for 46 days on average, 6 days faster than the year’s average. With inventory levels remaining low, sales may happen more quickly as buyers compete for fewer properties.
Less competition from other sellers – With past seasonal trends likely to persist, there would be 13.7% fewer sellers in the market this week compared to the average week during the year. Active inventory was 14.8% higher in February versus last February, but still 39.7% lower than pre-pandemic levels. This gap means there will continue to be opportunities for sellers entering the market this spring.
Below-average price reductions – Price reductions tend to be lowest in late winter and early spring as buyer activity ramps up. Historically, about 24.6% fewer homes have had a price decrease this week compared to the average week of the year. In 2023, this week saw about 8,000 fewer listings with price reductions compared to the average week of the year. (Realtor.com)
If you – or somebody you know – are considering buying or selling a home and have questions about the market and/or current home prices, please contact me on 617.834.8205 or [email protected].
Andrew Oliver, M.B.E.,M.B.A.
REALTOR®
m 617.834.8205
www.OliverReportsMA.com
www.OliverReportsFL.com
Stuart St James, Inc.
1 Washington Mall #3048
Boston, MA 02108
“If you’re interested in Marblehead, you have to visit the blog of Mr. Andrew Oliver, author and curator of OliverReportsMA.com. He’s assembled the most comprehensive analysis of Essex County we know of with market data and trends going back decades. It’s a great starting point for those l
New Listings, Inventory April 3
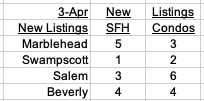
Here are the latest New Listings:

Click on these links for details:
Marblehead New Listings
Swampscott New Listings
Salem New Listings
Beverly New Listings
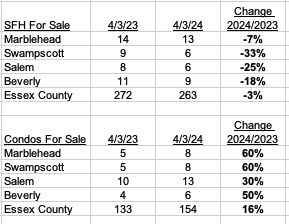
And here are the latest inventory numbers:

Read the March Inventory report: March Inventory shows no Improvement
And these recent articles:
MARBLEHEAD 2023 MARKET REPORT and 5-YEAR REVIEW
SWAMPSCOTT 2023 MARKET REPORT and 5-YEAR REVIEW
SALEM 2023 MARKET REPORT and 5-YEAR REVIEW
ESSEX COUNTY 2023 MARKET REPORT and 5-YEAR REVIEW
How was MY assessment calculated? Q&A with Marblehead Assessor Karen Bertolino
My Marblehead Current article on Property Taxes
Marblehead FY 2024 Property Tax Explained
Why Mortgage Rates will fall in 2024
How a tax break of up to $3,200 can help heat your home more efficiently this winter
Conventional Mortgage Loan Limits increased for 2024
INFLATION and RECESSION UPDATE

Recent Comments