Market still active while inventory remains low
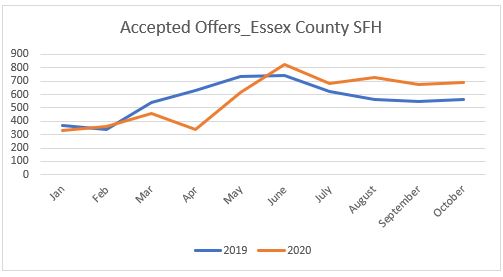
The number of Single Family Homes (SFH) in Essex County receiving offers recovered strongly from May onwards, and for the last several months has been ahead of 2019. YTD numbers are now slightly ahead of 2019 levels. The numbers would have been even stronger in recent months but for the chronic shortage of supply.
Single Family Homes
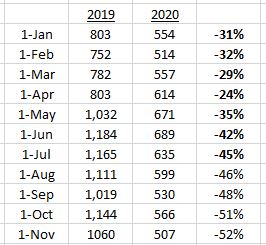
After years of decline, the number of SFHs for sale in Essex County on the first of the month compared with a year earlier (YOY) increased from August 2018 until June 2019. The decline then resumed, and has accelerated in 2020:
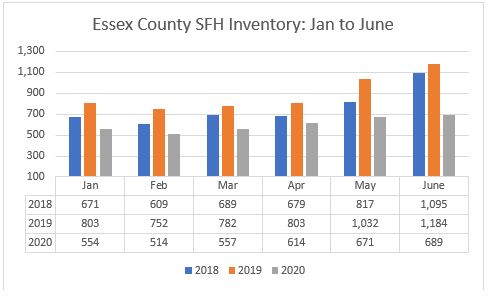
The next two charts (the first for January to June; the second July to December) show the number of SFHs for sale on the first of the month since 2018. In the first chart the numbers for 2020 YOY show the renewed decline (in 2019 inventory was increasing in the first 6 months of the year).
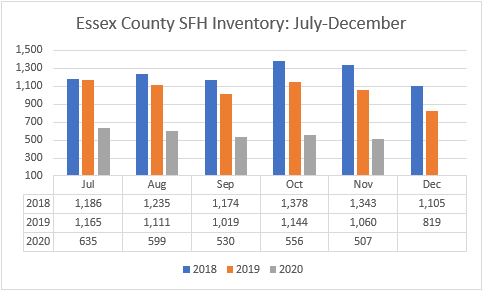
The second chart shows the decline YOY each month since July 2019 (note the decline both from 2018 to 2019 and again, much sharper, from 2019 to 2020).
Condos
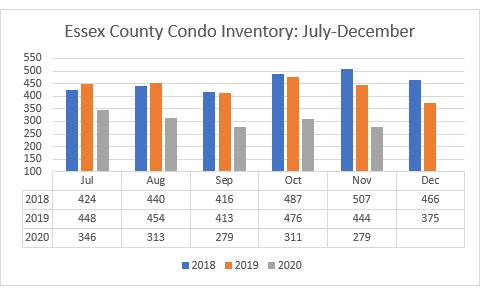
The number of condos for sale increased YOY from June 2018 until August 2019, but since then there has been a decline which has accelerated somewhat in 2020:
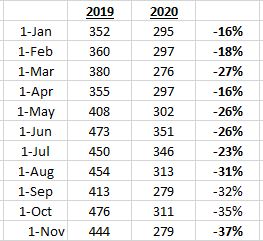
These two charts show numbers since 2018 for January to June, and July to December.
The first chart shows the decline in 2020 YOY, while in 2019 inventory was increasing in the first 6 months of the year.
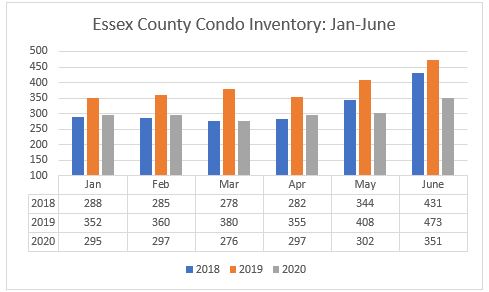
The second chart shows inventory has been declining since October 2019, with the rate of decline accelerating in 2020..
Supply
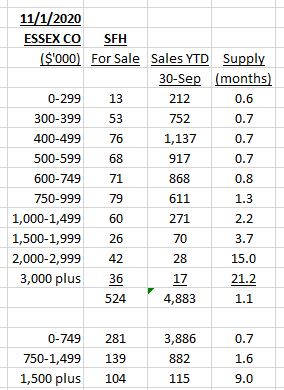
While the overall inventory of 1 month of supply remains well below the 6 months traditionally regarded as representing a market in equilibrium. While supply as usual becomes freer the higher the price bracket, it is notable that it does not exceed the traditional gauge of a market in equilibrium – 6 months of supply – until prices reach $2 million.
Comment
The market in recent months has been characterised by the twin challenges of reduced inventory and increased demand, with buyers from Boston adding to local demand; and both aided by record low mortgage rates.
We are back to the most basic economic equation: when demand exceeds supply, prices rise. In housing, that often results in bidding wars, as we are seeing frequently now.
Goodbye Boston, Hello Marblehead
Mortgage rates dip below 3% – where to next?
Lies, Damned Lies and Statistics: Q3 GDP growth
“If you’re interested in Marblehead, you have to visit the blog of Mr. Andrew Oliver, author and curator of OliverReports.com. He’s assembled the most comprehensive analysis of Essex County we know of with market data and trends going back decades. It’s a great starting point for those looking in the towns of Marblehead, Sale, Beverly, Lynn and Swampscott.”
Andrew Oliver
REALTOR®
Sagan Harborside Sotheby’s International Realty
One Essex Street | Marblehead, MA 01945
m 617.834.8205
www.OliverReports.com
Andrew.Oliver@SothebysRealty.com
Sotheby’s International Realty® is a registered trademark licensed to Sotheby’s International Realty Affiliates LLC. Each Office Is Independently Owned and Operated
