
Housing inventory: what is available in your town?
This article, the third in a series after Demand up, supply down and Inventory by price, looks at the current supply of Single Family Homes (SFH) and Condos in each of Essex County’s 34 cities and towns and compares it with the numbers for the last two years. Bear in mind that in February 2015 we were in the midst of the polar vortex winter of record cold, while both 2016 and 2017 (at least so far) have been quite mild. (more…)
Rockport 2016 Housing market By The Numbers
The median price of a Single Family Home (SFH) sold in Rockport in 2016 declined 9%, reflecting more sales at lower prices: 55% of sales in 2016 were below $500,000 compared with only 45% in 2015. The median price of a condo set a new record high, as 65% of the small number of sales occurred above $300,000, compared with only 45% in 2015. (more…)
Essex County Housing Inventory by price
This report shows housing inventory, broken down by price, for both Single Family Homes (SFH) and Condos on February 1st for the last three years. Read also Essex County Housing Market: demand up, supply down for an analysis of the market over the last three years. (more…)
Essex County Housing Market: demand up, supply down
Some things don’t change around here: the Patriots are going to the Super Bowl and housing inventory continues to decline.
The number of Single Family Homes (SFH) for sale
I show below the number of SFHs for sale on the 1st of each month since 2014 and the average number for the year. Between 2014 and 2016 the average number of SFHs for sale dropped 25% from 1,648 to 1,236. (more…)
Danvers 2016 Housing market By The Numbers
The median price of Single Family Home (SFH) in Danvers in 2016 rose 5% to a new record high pf $429,900, surpassing the prior 2006 peak of $413,500. The median price of a condo declined 5% and remains below the 2014 peak. Sales of SFHs were down slightly from the 2015 peak, while condo sales were well below the 2014 peak. (more…)
Boxford 2016 Housing market By The Numbers
While the median price of a Single Family Home (SFH) in Boxford in 2016 increased 7%, it remains below the levels of 2004 and 2005. Sales, however, jumped to a new high. There is no condo market in Boxford. (more…)
Amesbury 2016 Housing market By The Numbers
The median price of a Single Family Home (SFH) in Amesbury in 2016 was virtually unchanged from 2015 and still 10% below the 2005 peak. The median condo price increased 10% but is still 5% below the 2005 peak. Sales of SFHs increased while condo sales were flat and well below the 2004 level. (more…)
Andover 2016 Housing market By The Numbers
The median price of a Single Family Home (SFH) in Andover in 2016 declined slightly from the 2015 peak, although the second half of the year set a record. The median condo price showed a somewhat larger decline. Sales were more or less flat compared with 2015. (more…)
Essex County 2016 Housing market By The Numbers
The median prices for both Single Family Homes (SFH) and Condos set new records in 2016, each rising 5%. SFH sales also set a new high, while condo sales remained well below the peak level of 2005: (more…)
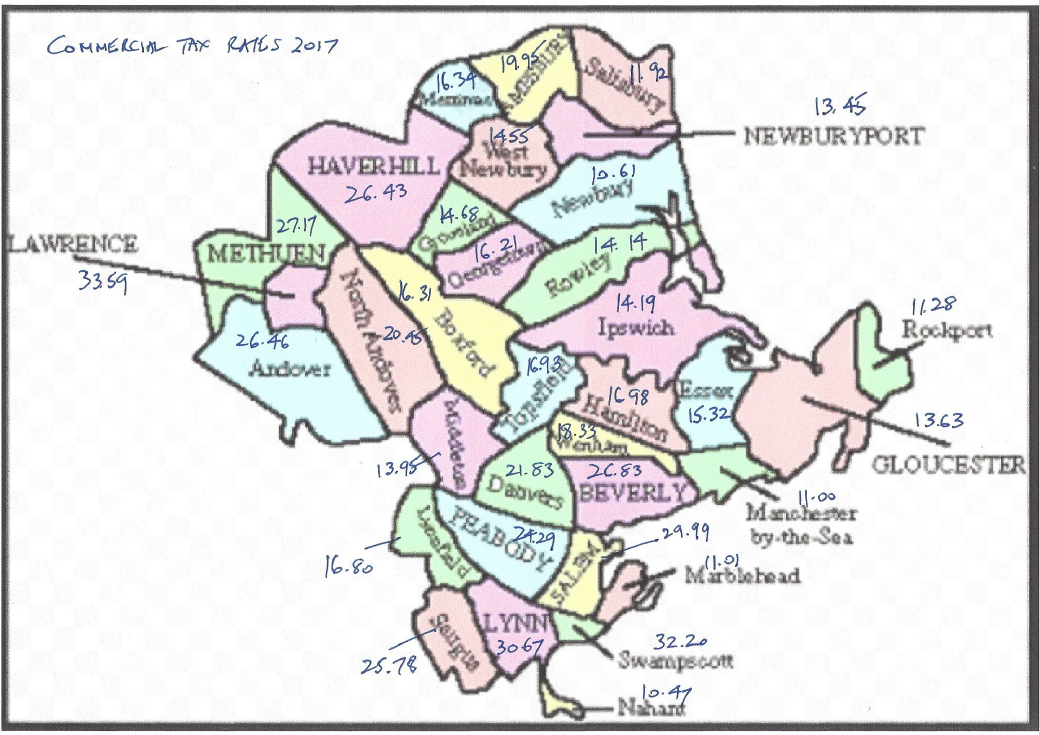
Commercial property tax rates: wide variations in Essex County
While most of us look at residential tax rates, far fewer are concerned with commercial tax rates. Yet a healthy commercial business environment can contribute significantly to the attractiveness of a town. The map below shows commercial rates in each of Essex County’s 34 cities and towns, followed by a table comparing residential and commercial rates.
Source: Mass Dept of Revenue
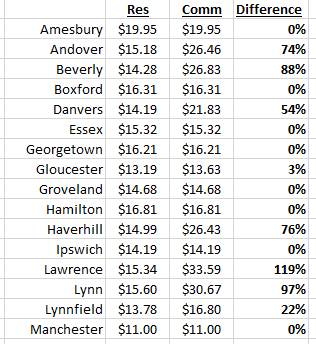
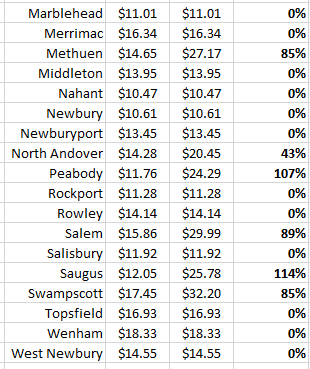
Commercial vs Residential rates
This table shows the residential and commercial rates and the percentage by which the commercial rate exceeds the residential one:
Source: Mass Dept of Revenue
There is a bigger variation in commercial rates than in residential rates
The lowest rate for both residential and commercial rates is Nahant’s $10.46, but while the highest residential rate is Amesbury’s $19.95, there are 12 towns with commercial rates over $20, with the highest being $33.59 in Lawrence. 20 towns set the same rate for both residential and commercial, while in 3 towns the commercial rate is more than double the residential one.
Why do some towns have different residential and commercial tax rates?
Cities and towns have the ability to increase the percentage of the total tax bill paid by commercial (and industrial and personal) property owners. The percentage of the value of property classified as commercial varies enormously from town to town. In Marblehead, for example, where residential property is almost 95% of the total, a 50% tax shift to commercial would increase the average commercial tax bill by $3,179 while reducing the average residential tax bill by only $179. Towns with a higher percentage of commercial property are more likely to shift an increased share of the tax bill to commercial owners.
Are you thinking of selling your home? If so please contact me on 617.834.8205 or Andrew.Oliver@SothebysRealty.com for a free market analysis and explanation of the outstanding marketing program I offer.
Not sure which broker to use to sell your home? Read Which broker should I choose to sell my house?
If you are looking to buy, I will contact you immediately when a house that meets your needs is available. In this market you need to have somebody looking after your interests.
Andrew Oliver is a Realtor with Harborside Sotheby’s International Realty. Each Office Is Independently Owned and Operated
@OliverReports
Housing Inventory continues to decline
The number of Single Family Homes (SFH) for sale at the beginning of December in both Essex County and Massachusetts has fallen by nearly a quarter over the last two years, with most of that decline coming in the last year, as shown in the charts below: (more…)
Huge jump in Mortgage Loan Limits
Home buyers in Essex County and Suffolk County received a major boost this week with the announcement that the limit for conforming mortgages was being increased by 18% from $523,250 to $598,000.
For a buyer putting down 20% the price of a home that can be financed conventionally – meaning that it can be sold to Fannie Mae or Freddie Mac – jumps by almost $100,000, from $654,063 to $747,500.
This table shows the trend in the last few years: (more…)
Mortgage rates near 4%: no need to panic
As anticipated in my Is this the end of ultra cheap mortgages? post last week, the rate on the 30 year Fixed Rate Mortgage (FRM) jumped to 3.94% this week, according to the latest Freddie Mac weekly survey. Before we all panic, let’s consider a few facts.
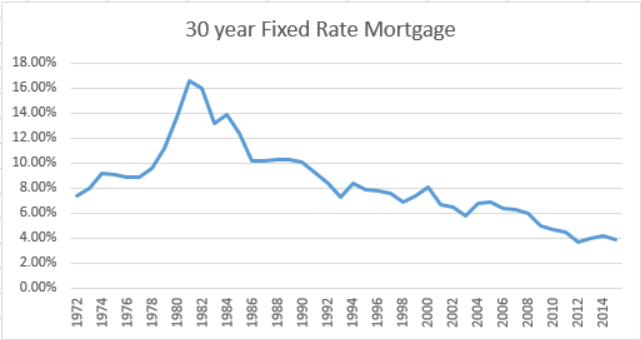
Mortgage rates are historically extremely low
Look at the chart below. Mortgage rates fell below 5% for the first time ever only in 2010. They averaged a little below 4% in 3 of the last 4 years, but even after the jump since the election rates are merely back to where they were a year ago and remain close to all-time lows. And during the boom years of 2004-2006 the average mortgage rates were 6.84%, 6.87% and 6.41%.
Source: Freddie Mac
There is no clear correlation between mortgage rates and home prices
Data for the last 10 years for national home prices starts as the housing boom was already over, but the chart below shows how home prices tumbled from 2007 to 2012 at a time when mortgage rates were also falling. Once the market turned, the spike in mortgage rates in 2013 did not stop the increase in home prices.
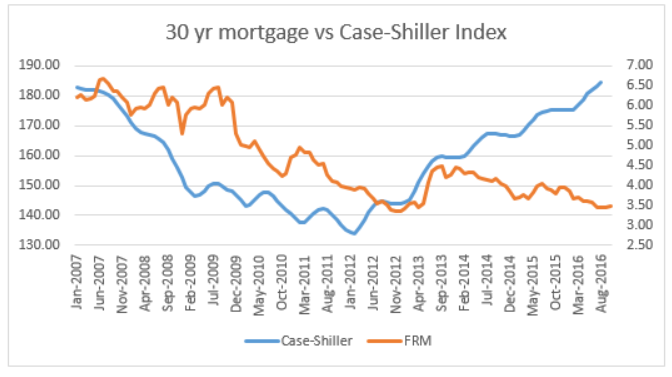
Source: Freddie Mac, S&P CoreLogic Case-Shiller
The next chart shows in a little more detail what has happened in the last 4 years. All I can say is that I see no direct correlation in the chart above or the one below between home prices and mortgage rates. That is not to say that mortgage rates do not have an impact on home prices, just that they are not the only factor.
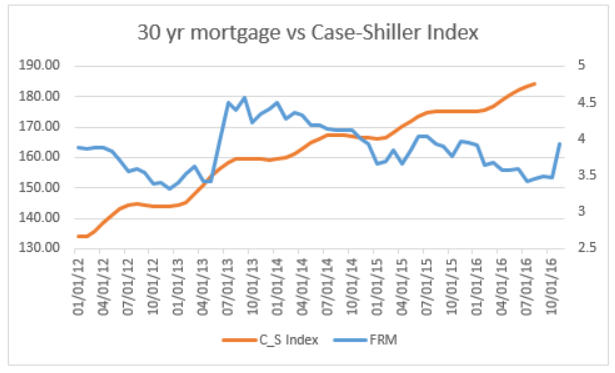
Source: Freddie Mac, S&P CoreLogic Case-Shiller
Is inflation going to rise?
Since the Great Recession, central banks have been pumping cash into world economies in an attempt to stave off deflation – falling prices. Why are falling prices so bad? Because some consumers will defer purchases in the belief that prices will be lower in the future. Since by some estimates consumer expenditure accounts for 70% of the economy, any concerted move by consumers to defer purchases would have a major negative effect on the economy.
So is inflation going to rise now that the Republicans control Congress and the White House? Probably, and that is the bet markets are making, causing the yield on the 10 year Treasury Note (10T) to jump nearly 0.5% in less than two weeks. And mortgage rates follow closely the yield on 10T.
Is renewed Inflation bad news for the economy?
As the Wall Street Journal put it: “The world should welcome higher long-term bond yields insofar as they signal a brighter outlook for economic growth and a return to moderate inflation after years of fear about falling consumer prices. Central banks have been trying hard—especially in Europe and Japan, without much success—to drag inflation higher. The long run of low rates also has battered banks, pension funds and insurance companies.”
Higher economic growth, the ending of the fear of deflation, relief for financial institutions – there’s a lot to like in moderate inflation – the key, of course, being moderate.
How does inflation affect real estate markets?
One of the key aspects of borrowing money in an inflationary environment is that the asset purchased will appreciate, while the loan will be paid back in depreciated dollars. The incentive, therefore, is to buy now before prices rise – the opposite to the concern in a time of deflation.
Will home prices continue to rise?
The chart below shows the growth in national home prices over the last 40 years. My reading of this is that we have now recovered from the sub-prime boom and bust cycle and that prices are likely to continue to grow modestly over time.
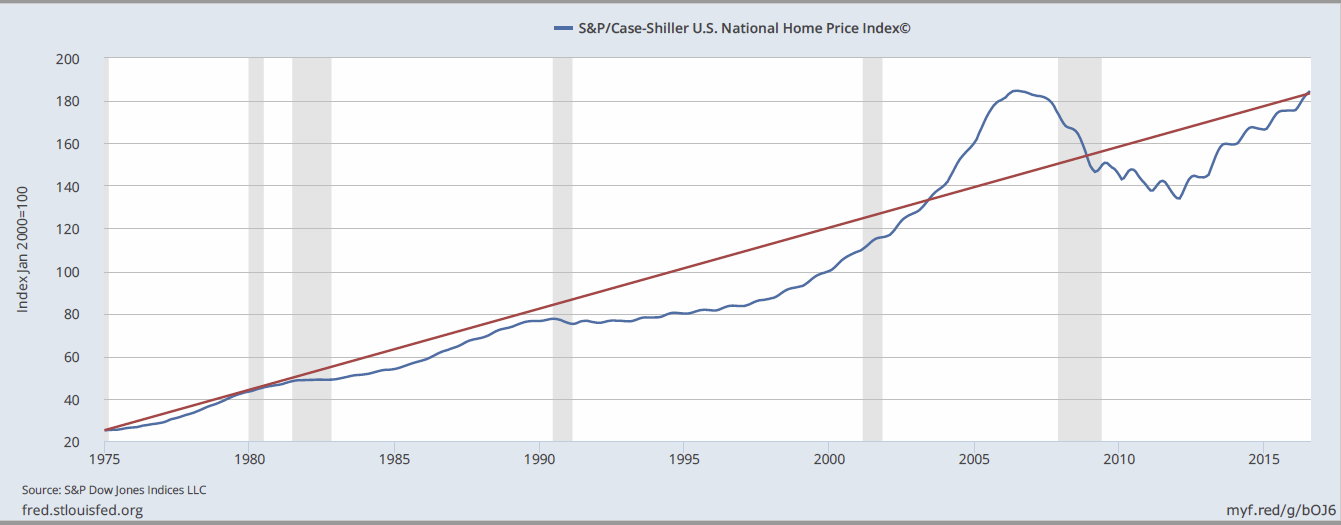
Source: Federal Reserve St. Louis; S&P CoreLogic Case-Shiller
If you are considering selling your home please contact me on 617.834.8205 or Andrew.Oliver@SothebysRealty.com for a free market analysis and explanation of the outstanding marketing program I offer.
Not sure which broker to use to sell your home? Read Which broker should I choose to sell my house?
If you are looking to buy, I will contact you immediately when a house that meets your needs is available. In this market you need to have somebody looking after your interests.
Andrew Oliver is a Realtor with Harborside Sotheby’s International Realty. Each Office Is Independently Owned and Operated
@OliverReports
Essex County Q3 market: town by town
In this post I report the numbers for the Single Family Home (SFH) market for each of the 34 cities and towns in Essex County.
Explanation of columns
The tables start with the median price for the first three Quarters for 2005 and 2006, the prior peak years, and then show 2015 and 2016 numbers.
The first highlighted column shows the percentage increase from 2015 to 2016; the second the comparison between 2016 and the prior high – normally 2005 but in some cases 2006.
The last three columns show sales YTD for 2015 and 2016 and the change.
The towns are listed, not alphabetically, but in the order of their percentage change in median price compared with the prior 2005/06 peak.
My comments are shown after the tables
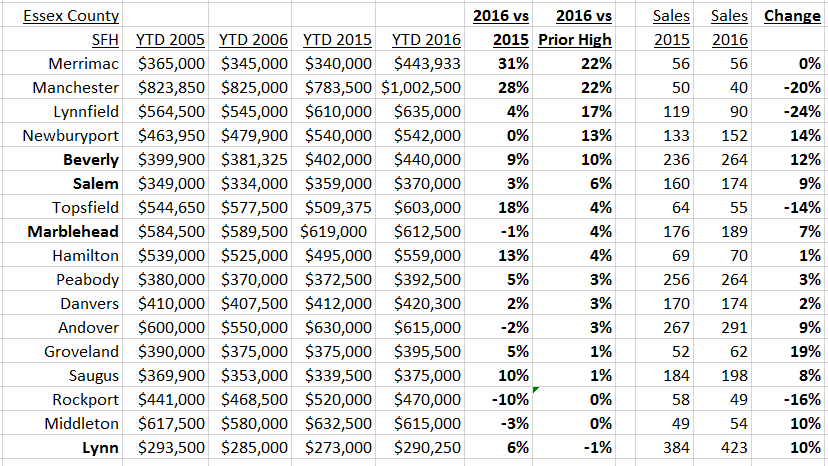

Source: MLS, Oliver Reports
Comment
As reported in previous posts, the median price of a SFH in Essex County and Massachusetts improve 4% and 2.5% respectively Year on Year (YOY), and in both cases set new record highs.
As always, though, the devil is in the detail.
Of the 34 cities and towns, 15 are at a new high, while 19 remain below their prior peaks. Going deeper, 5 towns – Merrimac, Manchester, Lynnfield, Newburyport and Beverly – show increases of 10% or more; while 7 – Salisbury, Nahant, West Newbury, Rowley, Georgetown, Wenham and Essex – show prices 10% or more below the earlier peak.
And Manchester-by-the-Sea is the first town to have a median price over $1 million, although I suspect it will drop back below that figure for the year as a whole.
The law of large numbers – and small
As a basic rule of statistics – and a pretty obvious concept – the larger the sample the more reliable is the number. Thus, note that the two towns with the highest increase and all of those with declines of 10% or more had sales of fewer than 100 units.
In the most extreme example, the numbers for the town of Essex reflect just 24 sales in 2005 and 19 in 2006 and the latter seems a more realistic indication of pricing.
My offer
Summary numbers such as those in this report are a good starting point – not the total answer – for the analysis of a town’s market.
Regular readers will know of the detailed reports I publish on individual towns and which I am happy to produce on request for any town.
If you are considering selling your home please contact me on 617.834.8205 or Andrew.Oliver@SothebysRealty.com for a free market analysis and explanation of the outstanding marketing program I offer.
Not sure which broker to use to sell your home? Read Which broker should I choose to sell my house?
If you are looking to buy, I will contact you immediately when a house that meets your needs is available. In this market you need to have somebody looking after your interests.
Andrew Oliver is a Realtor with Harborside Sotheby’s International Realty. Each Office Is Independently Owned and Operated
@OliverReports
Essex County Q3 housing market: on track for new record
The median price of a Single Family Home (SFH) in the 34 cities and towns of Essex County rose 4% to $420,000 in the third quarter and was also up 4% to $410,000 for the first three quarters. The market is clearly on track to break the 2005 peak of $394,400.
Sales were also up 4% for the first three quarters, but that included a drop of 8% in Q3, reflecting a more than 20% drop in the number of houses for sale. (more…)
Recent Comments