Marblehead’s 2025 Property Tax Explained
Marblehead’s property tax rate for Fiscal Year 2025 (July 1, 2024- June 30, 2025) has been set at $9.05, slightly up from $8.96 in FY 2024.
The formula for calculating the property tax is: take the $ amount of the previous year’s Tax Levy, add 2.5% for Proposition 2 1/2, and also add any New Growth (such as new construction or a condo conversion). This figure is the new tax levy. To this figure is added debt service – the Principal and Interest payable on the town’s debt – to produce the total Tax Levy.
The tax rate is then calculated by dividing the Tax Levy by the Assessed Value of property – and, crucially, that calculation is based upon prices as of January 1, 2024, using date from sales in calendar year 2023. What that means is that 2024 sales are used for the calculation of the tax rate in FY2026 – not FY2025.
Here are the numbers for Fiscal Years 2024 and 2025, remembering that FY 2025 runs from July 2024 to June 2025:
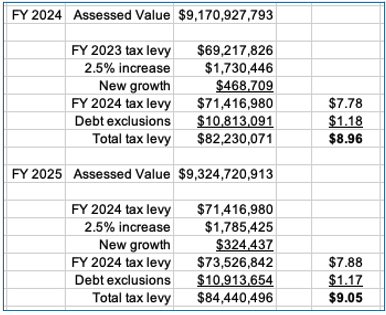
The Tax Levy calculation
The dollar amount raised by the property tax will increase year by year. That is because of the formula: last year’s number plus 2.5% plus new growth. In the table above you can see how the FY 2024 tax levy of $71,416,980 becomes the base for FY 2025. Add $1,785,425 for Prop 2.5% and $324,437 for new growth and the new figure is $73,526,842. To this number is added the debt service of $10,913,654 – to give a total amount to be raised of $84,440,496.
The Tax Rate (more…)
Marblehead 1st Half Sales: 50% Over List Price
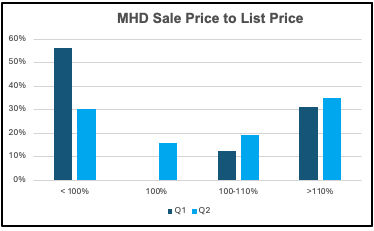
Half Sales over List Price in the first half of 2024
In the first half of the year, 4 in 100 sales were below List Price; 1 in 10 at List Price; and 5 in 10 over List Price.
11 of the 95 sales were 20% or more over List Price, including 2 at 40% over and 1 at 50% over.
If you – or somebody you know – are considering buying or selling a home and have questions about the market and/or current home prices, please contact me on 617.834.8205 or [email protected].
Andrew Oliver, M.B.E.,M.B.A.
REALTOR®
m 617.834.8205
www.OliverReportsMA.com
““If you’re interested in Marblehead, you have to visit the blog of Mr. Andrew Oliver, author and curator of OliverReportsMA.com. He’s assembled the most comprehensive analysis of Essex County we know of with market data and trends going back decades. It’s a great starting point for those looking in the towns of Marblehead, Salem, Beverly, Lynn and Swampscott.”
“Thank you for the wonderful, wonderful job you do for the community (explanation of property tax process and calculation) – it is so helpful and so clearly explained.”
Licensed in Massachusetts with Stuart St.James
Licensed in Florida with Compass
www.OliverReportsFL.com
Marblehead Mid-Year 2024 Market Review
The median price of the SFHs sold in Marblehead in the first half of 2024 rose to record highs – again- while sales were similar to the 2023 level.
The 23 Condos sold in a wide range – from $177,300 to $1.25 million — with 10 of the 23 sales under $500,000, and 9 over $700,000.
44% of all sales were Over List Price in Q1 and 54% in Q2
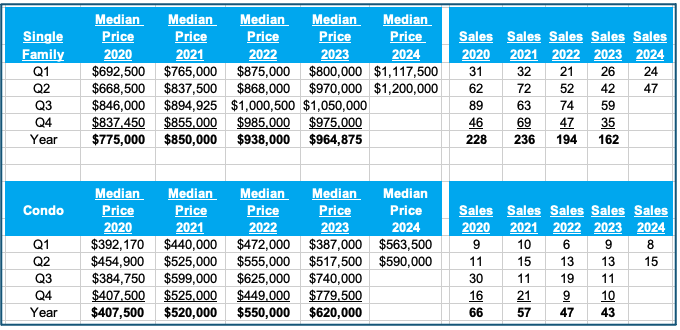
The Median Price per Sq.Ft. continued its ascent, while there was no slow down in the pace of sales, as evidenced by DTO- Days To Offer – the number of days a property is on the market before an accepted offer is received. (more…)
Marblehead House sell for $1.2 million OVER List Price
I think it was 2015 when I first wrote about Marblehead’s Unknown Oceanfront properties in the area off Atlantic Avenue from Preston Beach to Beach Street.
This week two houses in that area sold:
A house on Goldthwait Road, listed at $3 million, sold for $4.2 millon.
And one on Greystone Road, listed at $3.8 million, sold for $4.4 million.
I also referred to the area as Marblehead’s secret Oceanfront.
It seems that the secret is out.
Read these recent articles:
My Property Tax reports mentioned at Town Meeting
Marblehead Q1 2024 Market Summary
Swampscott Q1 2024 Market Summary
Salem Q1 2024 Market Summary
Essex County Q1 2024 Market Summary
Why Mortgage Rates will fall in 2024
If you – or somebody you know – are considering buying or selling a home and have questions about the market and/or current home prices, please contact me on 617.834.8205 or [email protected].
Andrew Oliver, M.B.E.,M.B.A.
Market Analyst | Team Harborside | teamharborside.com
REALTOR®
m 617.834.8205
www.OliverReportsMA.com
““If you’re interested in Marblehead, you have to visit the blog of Mr. Andrew Oliver, author and curator of OliverReportsMA.com. He’s assembled the most comprehensive analysis of Essex County we know of with market data and trends going back decades. It’s a great starting point for those looking in the towns of Marblehead, Salem, Beverly, Lynn and Swampscott.”
“Thank you for the wonderful, wonderful job you do for the community (explanation of property tax process and calculation) – it is so helpful and so clearly explained.”
Property Tax reports mentioned at Town Meeting
These are the reports Board of Assessors Chair John Kelley mentioned at Town Meeting this week:
marbleheads-property-tax-explained/
answers-to-frequently-asked-tax-rate-questions/
How was MY assessment calculated? Q&A with Marblehead Assessor Karen Bertolino
And read these recent articles:
Marblehead Q1 2024 Market Summary
Swampscott Q1 2024 Market Summary
Salem Q1 2024 Market Summary
Essex County Q1 2024 Market Summary
Why Mortgage Rates will fall in 2024
How a tax break of up to $3,200 can help heat your home more efficiently this winter
Conventional Mortgage Loan Limits increased for 2024
INFLATION and RECESSION UPDATE
If you – or somebody you know – are considering buying or selling a home and have questions about the market and/or current home prices, please contact me on 617.834.8205 or [email protected].
Andrew Oliver, M.B.E.,M.B.A.
Market Analyst | Team Harborside | teamharborside.com
REALTOR®
m 617.834.8205
www.OliverReportsMA.com
“If you’re interested in Marblehead, you have to visit the blog of Mr. Andrew Oliver, author and curator of OliverReportsMA.com. He’s assembled the most comprehensive analysis of Essex County we know of with market data and trends going back decades. It’s a great starting point for those l</p
Marblehead Q1 2024 Market Summary
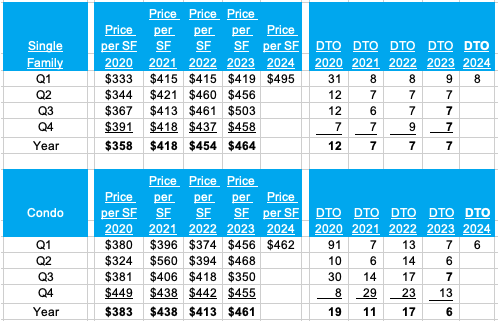
The median price of the SFHs sold in Marblehead in Q1 rose to a record high – but the number of sales is usually the lowest of the year and, therefore, the median price in Q1 is not necessarily an indicator of where median prices will end for the whole year.
5 of the 8 Condo sales were over $500,000, continuing the trend seen in 2023.
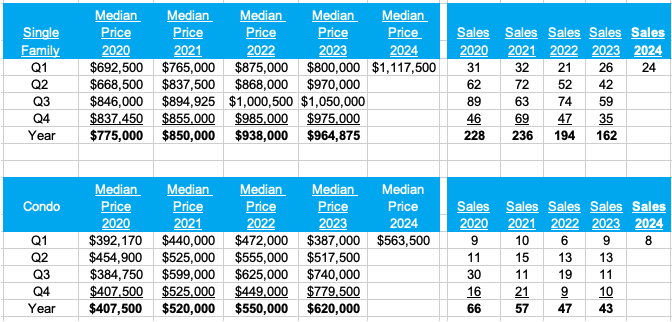
The median Price per Sq.Ft. can fluctuate Quarter to Quarter.
Sales continued at a brisk pace, reflecting both the shortage of supply and the continuing demand.
(DTO- Days To Offer – the number of before an accepted offer is received)
Please contact me for a market report for your property.
Andrew.Oliver @Compass.com
OliverReportsMA.com
Licensed with Stuart St. James in Massachusetts
Licensed with Compass in Florida
Marblehead House sells for 23% over List Price
The most frequent questions asked of Realtors is:”how’s the market?
Here’s one answer.
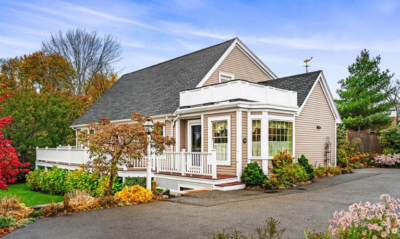
99 Atlantic Avenue was listed for sale on January 16 at $895,000 and sold on February 9 for $1,105,000, some 23% abhove List Price.
And by the way the Assessed Value is $675,800.
How was MY assessment calculated? Q&A with Marblehead Assessor Karen Bertolino
This is the thrid part in my series about the property tax assessment process. Links to the first two parts are included at the end of this 9 question Q&A.
Q. How is my property assessed each year?
A. All property is valued every year and is based on calendar year market sales in Marblehead. Fiscal Year 2024 began July 1, 2023, and is based on what existed January 1, 2023, so the preceding calendar year 2022 primarily is used for the basis of valuations.
Assessed values are based on fair market value using arm’s length sales in 2022. Our analysis does not use any foreclosures, short sales, family, estate, or private sales.
Components of an arm’s length transaction are a willing buyer and seller, who are unrelated, acting in their own best interest, neither under undue influence, the property is for sale in the open marketplace and the price represents the nominal consideration for the property sold unaffected by special or creative financing or sales concessions granted by anyone associated with the sale.
Every sale is reviewed to ensure that it is an arm’s length transaction by reviewing deeds, speaking with realtors and brokers knowledgeable about the sale, reviewing Multiple Listing Service (MLS), sale questionnaires and site inspections. Every year the Town Assessor is out in the field to observe changes in neighborhood conditions, trends and property characteristics.
The DOR criteria states that valuations must be between 90%-110% of fair market value. The Board of Assessors values close to 100% of fair market value depending on what is happening in the marketplace.
Additionally, appraising and assessing are based on the same principles and procedures of valuation with 2 distinct differences: number of homes viewed and market timeframe.
For example, if you hired an appraiser to value your home on July 1, 2023, they will compare your home to 3 to 6 properties that ideally sold on your street, if not in your neighborhood, if not in a similar neighborhood in town using current market sales. The comparable homes will be adjusted (grade, square footage, etc.) to arrive at an opinion of value for your home.
In Assessment, we are looking at all the single-family homes (condo’s, etc.) that sold in a past market, which in FY2024 is calendar year 2022. A statistical analysis of this data is performed by breaking it into sub-groups (gross living area, neighborhood, sales price, etc.) and then applied to market sales using the DOR criteria mentioned above.
Q. Are there different districts in town and do they have different values attributed to them?
A. Location is one of the biggest factors that impacts market value. Neighborhood codes are based on where your property is in town and take into consideration attributes such as style, age, etc. According to the Dictionary of Real Estate Appraisal, a neighborhood is, “A group of complementary land uses; a congruous grouping of inhabitants, buildings, or business enterprises.” Adjustments are made to the neighborhoods and properties as the marketplace dictates.
Q. Why has my assessment gone up so much while others have seen smaller increases? (more…)
MARBLEHEAD 2023 MARKET REPORT and 5-YEAR REVIEW
Just as in prior periods of housing market strength, the market in Marblehead saw a steady – rather than spectacular – increase in prices during the boom days of asset price increases, which were fueled by cheap credit, during and after the pandemic.
The reasons are as old as the town itself: Marblehead is a great place to live and bring up children, which is why people stay in their houses longer than they do elsewhere. Add to that, WFH (Work from Home), making the commute to Boston less of an issue.
The more than doubling of mortgage rates has also been a major factor in encouraging people to stay in their existing homes, further reducing the supply of homes for sale.
Finally, fluctuations in median prices can and do occur when the numbers are small, which is why the trend is more important than the exact numbers.
If you are thinking of selling, please contact me for a current market analysis for your property. Go HERE to download a pdf of this report and HERE to downlaod my Essex County report.
Median Price and Sales
The median price of the Single Family homes sold in Marblehead increased 34% from $717,500 in 2019 to $964,875 in 2023, and by 3% from 2022 to 2023. Sales were steady from 2019 to 2021, but dropped in 2022, and again in 2023. (more…)
Marblehead FY 2024 Property Tax Explained
Marblehead’s property tax rate for FY 2024 (July 1, 2023- June 30, 2024) has been set at $8.96, down from $10.00 in FY 2023 following a dramatic 16% increase in Assessed Values.
The formula for calculating the property tax is: take the $ amount of the previous year’s Tax Levy, add 2.5% for Proposition 2 1/2, and also add any New Growth (such as new construction or a condo conversion). This figure is the new tax levy. To this figure is added debt service – the Principal and Interest payable on the town’s debt – to produce the total Tax Levy.
The tax rate is then calculated by dividing the Tax Levy by the Assessed Value of property – and, crucially, that calculation is based upon prices as of January 1, 2023, using date from sales in calendar year 2022. What that means is that 2023 sales are used for the calculation of the tax rate in FY2025 – not FY2024.
Here are the numbers for Fiscal Years 2023 and 2024, remembering that FY 2024 runs from July 2023 to June 2024.

The Tax Levy calculationThe dollar amount raised by the property tax will increase year by year. That is because of the formula: last year’s number plus 2.5% plus new growth. In the table above you can see how the FY 2023 tax levy of $69,217,826 becomes the base for FY 2024. Add $1,730,446 for Prop 2.5% and $468,709 for new growth and the new figure is $71,416,980 . To this number is added the debt service of $10,813,091 – to give a total amount to be raised of $82,230,071..
The Tax Rate
The actual tax rate depends upon the total Assessed Value of all property: residential, commercial and personal. The tax rate is calculated by dividing the total dollar amount to be raised by the total Assessed Value of all property. Thus, while the $ amount raised by the tax (and therefore the median tax bill) will increase each year, the headline tax rate will fluctuate depending upon the direction of Assessed Values.
In simplistic terms, the $ amount raised before debt service will increase by a little more than 2 1/2% each year, so if the median Assessed Value also increases by a little more than 2 1/2% the tax rate will be unchanged. If the increase in Assessed Values is less than 2 1/2%, then the tax rate will rise. And if the increase in Assessed Values is more than 2 1/2% then the tax rate will fall. One additional factor is the cost of debt service.
In FY 2023 the tax rate was $10.00, achieved by dividing the $79.1 million to be raised by the $7.9 billion of Assessed Value. And in FY 2024 the calculation is $82.2 million divided by $9.2 billion, which produces a rate of $8.96. The median tax bill, based on the higher Assessed Values, will increase by $244 or 3%, to $8,318.
Note that the calculation of the tax rate is made simpler by the fact that Marblehead’s Select Board votes each year to have a single tax rate for both residential and commercial property. In towns which elect to have a differential rate – i.e. by taxing commercial property at a higher rate than residential – there are generally two different tax rates, achieved by dividing the amount to be raised from residential and commercial taxpayers by their respective aggregate Assessed Values.
How does debt service affect the tax rate?
The announced property tax rate announced each year also includes the cost of debt service:

What is the outlook for FY 2025?
In 2023, the year that is the basis for the FY 2025 property tax calculation, the median MLS SFH sale price through December 16 was $987,000, an increase of 4% from 2023’s $938,000. This suggests that the actual tax rate should be flat or show perhaps a slight decline for FY2025, but we will get a clearer idea after the town publishes its budget next February .
Read these recent reports: Why Mortgage Rates will fall in 2024
How a tax break of up to $3,200 can help heat your home more efficiently this winter
Conventional Mortgage Loan Limits increased for 2024
INFLATION and RECESSION UPDATE
Most Sales Still Over List Price
Core Inflation Prices Barely Budged in August
MARBLEHEAD Q3 MARKET REPORT 2019-2023
SWAMPSCOTT Q3 MARKET REPORT 2019-2023 SALEM Q3 MARKET REPORT 2019-2023
ESSEX COUNTY Q3 2023 MARKET REPORT
(more…)
Marblehead Q3 Market Report 2019-2023
Median Price and Sales
The median price of the Single Family homes sold in Marblehead increased 31% from $718,500 in 2019 to $938,0000 in 2022. Sales were steady from 2019 to 2021, but dropped in 2022, and again YTD in 2023. The YTD 2023 median price is $964,750, up 4% from 2022 YTD.
The median price of the Condos sold increased by 38% from $398,900 in 2019 to $550,000 in 2022, with sales following a similar pattern to that for SFs. Q3 2023 saw 5 of the 7 sales YTD over $750,000 and, with only 11 sales in the Quarter, this drove up the median price. By contrast, 4 of the 6 sales under $400,000 took place in Q1, driving down the median price. YTD the median price is $575,000, more in line with the 2022 number.
Just as in prior periods of housing market strength, the market in Marblehead saw a steady – rather than spectacular – increase in prices during the boom days of asset price increases which were fueled by cheap credit, during and after the pandemic.
Similarly, Marblehead did not see the correction experienced by other parts of the country in the second half of 2022, as interest rates rose sharply.
The reasons are as old as the town itself: Marblehead is a great place to live and bring up children, which is why people stay in their houses longer than they do elsewhere. Add to that, WFH (Work from Home), making the commute to Boston less of an issue.
The more than doubling of mortgage rates has also been a major factor in encouraging people to stay in their existing homes, further reducing the supply of homes for sale.
Finally, fluctuations in median prices can and do occur when the numbers are small, which is why the trend is more important than the exact numbers.
Go HERE to download a copy of the full report.
And read these recent articles:
Most Sales Still Over List Price
Core Inflation Prices Barely Budged in August
October Inventory shows Sharp Jump from September</a.
Credit Score Change Could Help Millions of Buyers
August Sales still mostly over List Price
2023 Sales Continue Strongly over List Price (more…)
Most Sales Still Over List Price
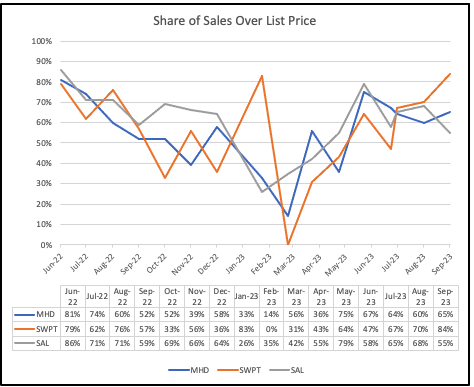
Sales in September in Marblehead, Swampscott and Salem continued to be mostly over List Price:
And read these recent articles:
Most Sales Still Over List Price
Core Inflation Prices Barely Budged in August
October Inventory shows Sharp Jump from September</a.
Credit Score Change Could Help Millions of Buyers
August Sales still mostly over List Price
2023 Sales Continue Strongly over List Price (more…)
August Sales still mostly over List Price
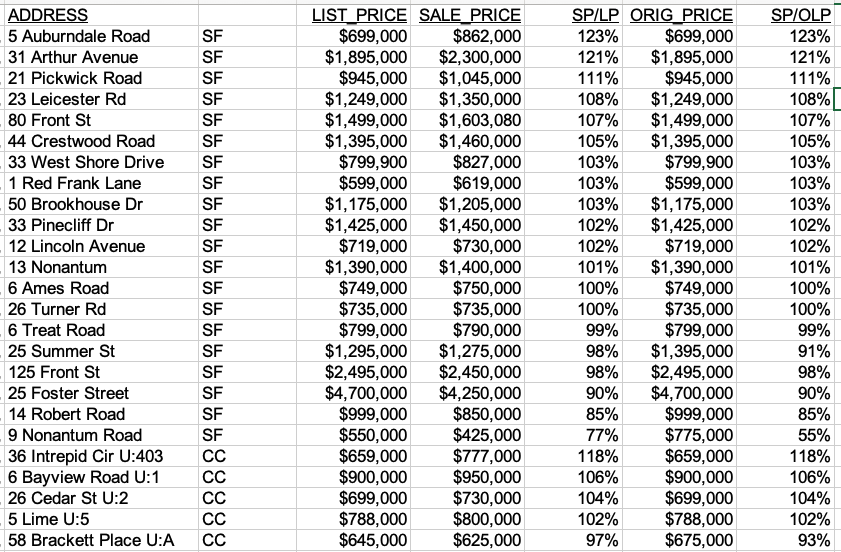
In August 60% of sales in Marblehead, 70% of Swampscott sales and 68% of Salem sales, were over List Price.
Marblehead
Swampscott (more…)
2023 Sales Continue Strongly over List Price
The chart and table below show how the percentage of sales (of SFHs and Condos) dropped in the last few months of 2022 and early months of 2023, befre recovering strongly from the spring of 2023 onwards.
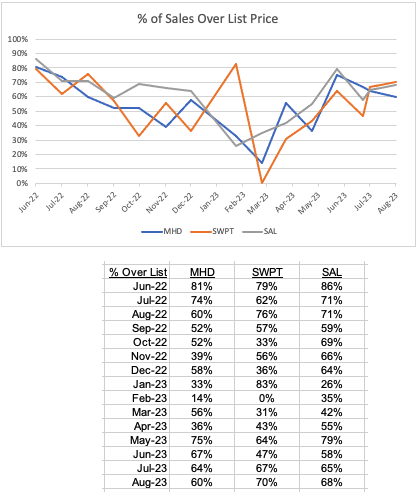
Note that the actual numbers in some months are quite small which can lead to fluctuations – but the overall message is clear: most properties continue to sell over list price.
And these recent articles:
August Sales still mostly over List Price
2023 Sales Continue Strongly over List Price
No signs of improvement in September Housing Inventory (more…)
2 of Every 25 U.S. Homes Worth at Least $1M
While $1M signified luxury property a short while ago, it’s now 8% of the nation’s housing stock – but a large percentage of those homes are still in Pacific Coast states..
The share of homes worth seven figures is on an upswing after dipping to a 12-month low (7.3%) in February because prices are rising on a year-over-year basis after a decline early in the year.
Overall, the median U.S. home-sale price rose 3% in July, the biggest increase since last November, according to Redfin, with luxury home prices rising even faster – up 4.6% year over year to $1.2 million in the second quarter.
Elevated mortgage rates discourage potential home sellers, who are staying put to keep their relatively low mortgage rates. As a result, inventory dropped so low that buyers still in the market are competing for those few homes that are for sale. That’s driving up home prices and pushing many of those listings above the million-dollar mark.
“The supply shortage is making many listings feel hot,” said Redfin Economics Research Lead Chen Zhao. “In most of the country, expensive properties that are in good condition and priced fairly are attracting buyers and in some cases bidding wars, mostly because for-sale signs are few and far between right now.”
The share of homes worth seven figures has doubled since before the pandemic. In June 2019, just over 4% of homes were valued at $1 million or more.
East Coast metros gain most $1 million-plus homes
Over one-quarter (25.8%) of homes in the Bridgeport, CT metro – which has many popular New York City suburbs – are worth at least $1 million, up from 23.1% a year ago, the biggest increase of the metros analyzed. It’s followed by Boston, where the share increased from 20.3% to 21.5%, and Newark, N.J. (8.7% to 9.7%). (more…)

Recent Comments