How did North Shore Home Prices Perform in the last Decade?
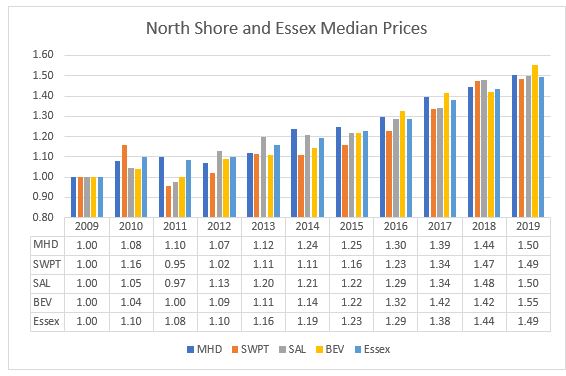
The decade from 2010-2019 saw a remarkably consistent record of Single Family Home Price increases throughout the North Shore and Essex County.
For the purposes of comparison I have converted all prices to a base of 100 for 2009.
The first chart shows the performance of Marblehead, Swampscott, Salem, Beverly and Essex County as a whole. If you look at the numbers for 2019 you can see how consistent the performance was, with a 50% increase over the decade.

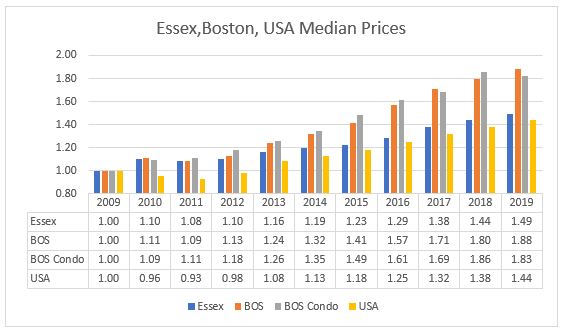
With that consistency I have just used Essex in comparison with Boston and with the US as a whole, as measured by the S&P/ Case-Shiller National Index.

This shows that while Essex County slightly out-performed the US as a whole, it trailed far behind Boston.
While this is not surprising, it does confirm the financial reason that many young people have been moving out from Boston to the North Shore.
Will house prices continue to rise in 2020?
Are You Thinking of Selling in 2020?
How is Marblehead’s 2020 Property Tax rate calculated?
How is Swampscott’s 2020 Property Tax Rate calculated?
Andrew Oliver
Market Analyst | Team Harborside | teamharborside.com
REALTOR®
Sagan Harborside Sotheby’s International Realty
One Essex Street | Marblehead, MA 01945
m 617.834.8205
www.OliverReports.com
Andrew.Oliver@SothebysRealty.com
Sotheby’s International Realty® is a registered trademark licensed to Sotheby’s International Realty Affiliates LLC. Each Office Is Independently Owned and Operated
