
Make sure your plumbing pipes are protected. Pipes freeze under three common scenarios: quick temperature drops, poor insulation and thermostats that are set too low. (more…)
Property tax rates: 2017 Essex County town by town guide
(Click here to download a pdf of the 2018 report.)
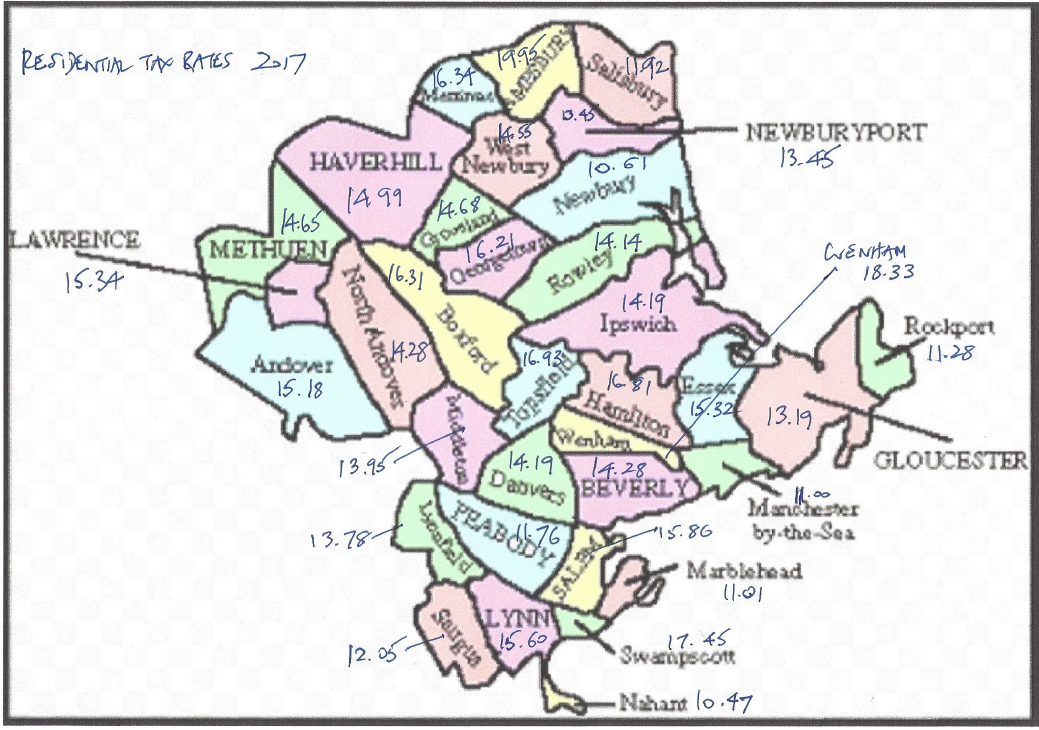
Essex County property tax rates for FY 2017 for all 34 cities and towns have been announced and the bills will be arriving in the mail any day now. (Spoiler warning – your taxes are going up!) Below is a map (so that you can compare tax rates in neighboring towns) followed by an alphabetical list of tax rates for the last three years. After that I explain how taxes are calculated and give an early look at the likely outcome for 2018.
You can download a pdf of this report by clicking here.
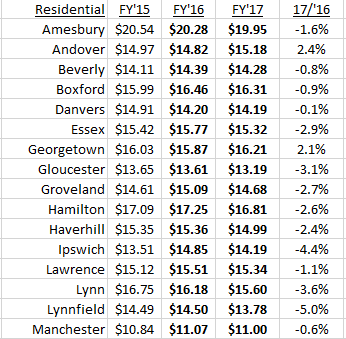
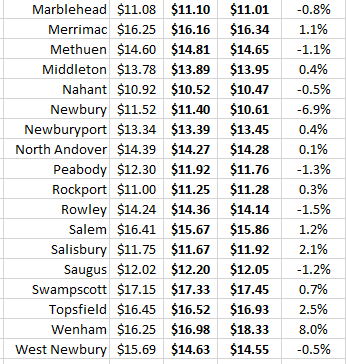
Source: Mass Dep of Revenue
Median and Average Tax Rates
The median and average tax rates are both $14.41. The highest taxed town, Amesbury, is therefore 38% higher than the average, while the lowest, Nahant, is 27% below the average. Or put another way, the highest tax rate in Essex County is 90% higher than the lowest.
Tax Rates of Neighboring Towns
Where taxes become interesting is when one can compare tax rates in neighboring towns. Many people, especially those moving to the area, whether from Boston or elsewhere, are willing to consider more than one town.There are many factors in the decision about where to live, but tax rates can be a significant influence on the decision.
Note, for example, that Marblehead’s rate is much lower than Swampscott’s; Newbury’s is significantly lower than the surrounding towns’; and that Manchester’s is a lot lower than Hamilton’s or Wenham’s. Some – normally the officials of higher-taxed towns – argue that their lower property values offset higher taxes. Frequently, however, residents of highly taxed towns cite taxes as a reason for wanting to move.
Tax rate changes in 2017
Of the 34 cities and towns in Essex County, 22 have announced decreases in their tax rate while 12 have had increases approved.The median change was a decrease of just 0.7%.
Of the 22 decreases 13 were 2% or less, while the largest decrease was the 6.9% in Newbury.
7 of the 12 increases were 2% or less. The largest increase by far was the 8% in Wenham, where the removal of Penguin Hall from tax rolls impacted the total valuation.
How property tax rates are calculated
There are two main points to understand:
The dollar amount raised by property taxes is based on a simple formula: the dollar levy for the previous year plus 2 1/2% (Prop 2 1/2), plus any new growth (e.g. new construction), plus any voter-approved overrides or debt exclusions.
The tax rate is then calculated by dividing the dollar amount by the Assessed Value of all property. For FY 2017 (July 2016-June 2017) Assessed Values are based upon sales during 2015.
Thus, the dollar amount (and tax bills) will always increase from year to year, but the tax rate depends upon what happens to Assessed Values (AV). Here are examples. All assume a 4% increase in the dollar amount to be raised from taxes.The variable is the change in the AV. In the years when AVs were declining, tax rates rose. As AVs are now increasing we should expect to see tax rates flat to down.

Outlook for FY 2018
As we approach the year end the median price of a Single Family Home in Essex County will increase about 5% in 2016, and it is 2016 sales which will be used in calculating FY 2018 tax rates. Since the dollar amount to be raised from property taxes will naturally continue to increase, at this stage it seems reasonable to expect a modest decline in tax rates for FY 2018, but there will, as always, be fluctuations from town to town.
If you – or somebody you know – are considering buying or selling a home and have questions about the market and/or current home prices, feel free to contact me on 617.834.8205 or Andrew.Oliver@SothebysRealty.com.
Read Which broker will find the buyer for my house?
Andrew Oliver is a Realtor with Harborside Sotheby’s International Realty. Each Office Is Independently Owned and Operated
You can REGISTER to receive email alerts of new posts on the right hand side of the home page at www.OliverReports.com.
@OliverReports
Merry Christmas from Santa’s house
Do watch this delightful short video from Zillow of Santa’s house

Source: Zillow
Merry Christmas to you all. Ho ho ho! (more…)
New Listings week of December 23
There are just three new listings this week and no Open Houses tomorrow (there is one on Monday at 3 Lightning Lane in Salem from 1:30 -3:00):
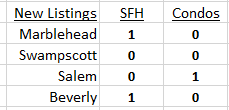
Source:andrewJoliver.com
Mortgage Rates continue to rise – is this the peak for now?
As expected, mortgage rates increased again this week, reaching 4.3%, a level not seen since….as recently as April, 2014. (more…)
Open Houses December 18
The snow has gone, so visit these Open Houses and pick a new home to put under the tree: (more…)
Mortgage rate outlook after Federal Reserve increases rates
For the second time since the introduction of the iPhone (the first was in December 2015) the Federal Reserve (Fed) increased interest rates this week. The increase, like last year’s, was 1/4%. What does this mean for mortgage rates? The key is to understand which rates are impacted by the Fed Funds rate and which are dependent upon interest rates set by the market.
Which rates are based upon the Fed Funds rate?
30 year fixed rate mortgages (FRN) are not based on the FF rate, but are most closely tied to the yield on 10 year US Treasuries(10T). More on that in a minute. (more…)
Will Marblehead reach 250 SFH sales in 2016?
My very first post on Oliver Reports in November 2012 referred to the expectation that sales of Single Family Homes (SFH) would exceed 200 that year for the first time since 2007. They did reaching 227. And this year, as of December 16, there have been 240 sales with a further 9 scheduled to occur before the end of the year, suggesting that sales in 2016 will fall just shy of 250, a good level but still below the 285 of 2004. There is no doubt that the shortage of houses for sale held back the number of sales in 2016.
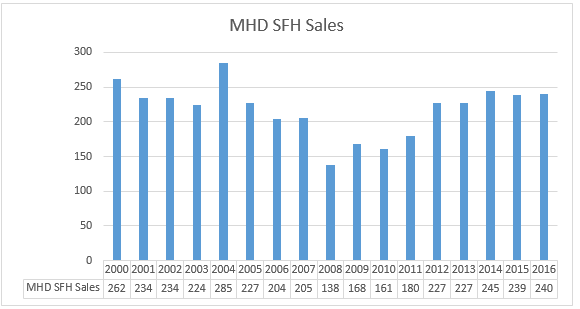
2016 through December 16 Source: MLS, Oliver Reports
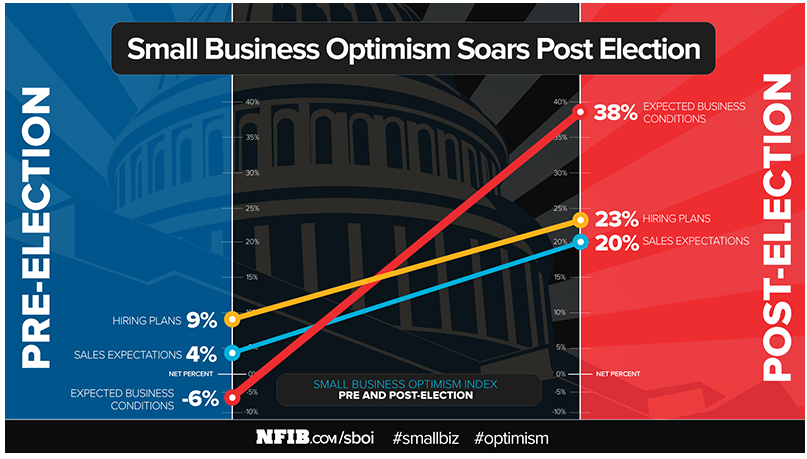
Small Business Optimism Soars after Election
Small business optimism remained flat leading up to Election Day and then rocketed higher as business owners expected much better conditions under new leadership in Washington, according to a special edition of the monthly NFIB Index of Small Business Optimism.
“The November index was basically unchanged from October’s reading up to the point of the election and then rose dramatically after the results of the election were known.”
The full November index, calculated as it is every month, improved 3.5 points to 98.4, which is just above the 42-year average and only the third time since 2007 that it has broken into above average territory.
New Listings week of December 16
No surprise – another quiet week for new listings: (more…)
One reason mortgage rates won’t go up this week
With the near certainty that the Federal Reserve (Fed) will vote to increase interest rates this week, many people assume that mortgage rates will automatically follow. Not so. At least not directly. The Federal Reserve’s decision on interest rates will have no direct impact on fixed rate mortgage rates.
The last time the Fed raised interest rates was just a year ago and at that time I wrote What the Fed’s rate increase means for mortgage rates.
I will update the report after the Fed’s decision on Wednesday. (more…)
Solar roof tiles 2.0 – a major improvement
Just over a year ago I published Solar panels – are they right for you?, with a not very positive comment based largely upon their appearance.
As with many products, however, dramatic improvements seem to have been made and a recent Bloomberg video
No one saw Tesla’s solar roof coming shows just how much. When Elon Musk of Tesla presented recently, the audience members were unaware that the homes showed had solar roofs. “The interesting thing is that the houses you see around you are all solar houses,” Musk said. “Did you notice?”

Open Houses Sunday December 11
A chilly start to the day but it will be sunny with no wind so get out and visit these Open Houses: (more…)
Why the Election drove Mortgage Rates up
30 year Fixed Rate Mortgage (FRN) rates are tied to the yield on the US Treasury 10 year note (10T). The spread – the difference between the two rates – has averaged 1.71% since the beginning of 2013, as shown in this chart (the sharp drop at the end reflects the first couple of days after the Election):

Source:US Treasury, Freddie Mac
Now let’s look at what has happened in the month since the Election – after the initial drop the spread has returned to its 4 year average: (more…)
New Listings week of December 9
It’s beginning to feel a lot like Christmas in the real estate market, as new listings drop with the temperature: (more…)
Recent Comments