Free Property and Mortgage Fraud alert notification for homeowners
It has been reported by the FBI that one of the quickest growing white collar crimes in America is property and mortgage fraud. This happens when a person knowingly records a fraudulent document making it appear that they own another person’s property or that the owner owes them money.
Southern Essex’s state-of-the-art Property Watch Service allows you to view the document the same day it was recorded and print it at no cost.
How it works: (more…)
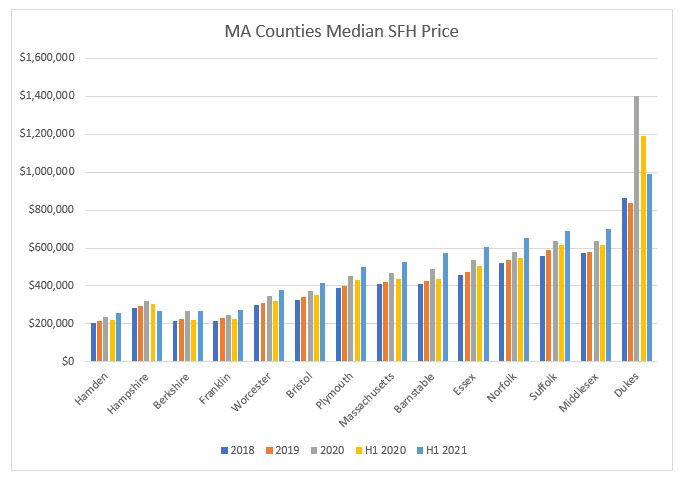
Which is Massachusetts’ most expensive County
7 Counties have a median price lower than the median for the State while 6 clock in above that level – which was $525,000 in the first half of 2021, up 20% from H1 2020 and 28 % from 2018.
Buyers are overpaying, but are there signs of a bubble?
As prices continue to soar, Housing Wire asks the question: Are there signs of a bubble?

“The national average of home prices rose 14.4% year-over-year to $336,200 in February – the largest increase since July 2013, according to the latest report from Redfin. As proof of the impact of the country’s low inventory and high cost of building materials, new listings fell 16% – the second-largest decline on record since Redfin’s data began in 2012, only passed by the drop in April 2020.
Mortgage rates have also jumped to north of 3%; at its current pace, the Mortgage Bankers Association is forecasting rates will reach nearly 3.5% by the end of 2021. New home applications are down as well, as builders are still struggling with smaller-than-normal crews and expensive materials that are hard to procure. And even with March well underway, mortgage applications are still in decline.”
Redfin’s chief economist makes the profound comment that : “It seems like the only move-up buyers who are confident enough to list their homes are those who are relocating to a more affordable area where they’ll have an edge on the local competition.”
I can confirm that as I was talking just yesterday to an agent whose client with a $2 million house won’t list it because “she cannot find anything to buy.”
But to come back to the question in this article: are we in a bubble? (more…)
Is the seller’s market coming to an end?
A really interesting article from boston.com asks the question we’d all like to know the answer to: Is the sellers’ market coming to an end?
Witness for the prosecution
According to the President of the Greater Boston Association of Realtors, reporting that the median Single Family Home (SFH) price in Greater Boston had increased just 1.7% to $605,000 over the last 12 months, while the median condo price had slipped 4.1% to $549,000: “The seller’s market is likely over, or at least the balance has shifted. With sale prices having begun to stabilize, more homes and condos available for sale, and properties sitting on the market longer, home values have most likely peaked in many areas.”
Witness for the defence
According to a report from The Warren Group, in Massachusetts as a whole in September, the median SFH price rose 5 percent on a year-over-year basis to $399,000, but the real action was in the condo market, where the median price jumped 14.3% to $375,000.
Comment
Lies, damned lies and statistics was the first article I wrote for the Marblehead Reporter in 2008.The point I made then, and have repeated many times since, is that statistics can be distorted to suit the argument one is trying to make – rather like the way Opinion Polls slant questions to get the answer the sponsor wants.
In real estate I don’t believe there is an intent to mislead; I think it is often a writer quoting statistics without explaining them.
Having said that, the number one reason that I NEVER quote monthly statistics is that they can vary greatly and IMO are pretty meaningless.
Let’s look at Massachusetts sales to see if I can make my reason clear.
Our starting point is the comment that the median price in September (one month) increased 5% Year over Year (YOY) for SFHs and 14.3% for condos. We are using different sources for numbers (mine from MLS, Warren from public records, thereby including more sales) but the numbers for the month of September are quite similar. But look below at the monthly figures for July, August and September, followed by those for the entire quarter – Q3.
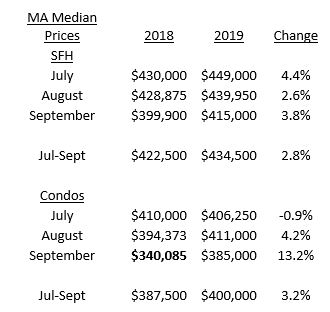
For SFHs the monthly increases are quite consistent.
But now look at condos. Note that I have high-lighted September 2018 when the median price was out of whack at just $340,085. The September 2019 median price was down from July and August but up sharply compared with September 2018 – which was an outlier.
So we look at the quarter – Q3 – and see that the median prices was up 3.2%, similar to the 2.8% for SFHs.
Confession time. I have statistics going back to 2000 for all 34 cities and towns in Essex County plus Essex and Middlesex Counties and Massachusetts. In all the years of keeping records the only time I have calculated a monthly statistic was – for this article.
Especially in New England, there is too much fluctuation even from quarter to quarter, in large part because of seasonality caused by….weather. To give another example, I worked with a seller in Watertown and he had a report from another Realtor showing that the median price had dropped by a large amount – something like 20% – for ONE MONTH and suggesting that prices would show a decline in coming months. By showing longer-term data I was able to persuade the seller that the one month figure was meaningless – and in fact the median price increased by double digits in the second half of the year.
So how is the market?
What was long ago called the $64,000 question, when $64,000 still bought something of value.
By now you will understand that I like to use quarterly data and – better yet – Year to Date as we get to 6 and 9 months.
Here’s another table:
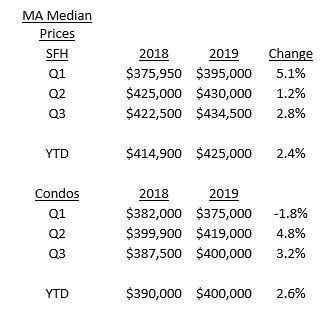
For both SFHs and Condos the YTD increase is =/- 2.5% – and in each case Q3 was a little higher than that figure, not suggesting a slowing of the rate of price increases.
But…..MA is a very big place! And numbers for condo median prices are distorted because Massachusetts includes….Boston. In fact, the median price of condos in Boston has dropped 3.1% YTD meaning that excluding Boston the median price has actually increased by 4.6%.
Yes, I know, your head is spinning with all these numbers. And I will add one more. Note that the median prices quoted at the beginning for Greater Boston were $605,000 for SFHs and $549,000 for condos. Compare that with $399,000 for SFHs and $375,000 for Condos in the Warren Group report. In both cases the Greater Boston numbers are about 50% higher than for the State as a whole. The Boston and surrounding towns effect.
Conclusion
As I said nobody is trying to mislead the consumer (or home buyer or seller), but I repeat what I often say to people when they are shown a statistic:”tell me what that means”.
Even if numbers confuse you (and as a numbers wonk that is hard for me to believe….) there is no reason not to ask for an explanation, as they say in prospectuses nowadays, “in plain English.”
For detailed Q3 reports on Marblehead, Swampscott, Salem and Beverly, as well as a town-by-town summary for the 34 cities and towns of Essex County, click
Team Harborside Market Reports.
Andrew Oliver
Market Analyst | Team Harborside | teamharborside.com
REALTOR®
Sagan Harborside Sotheby’s International Realty
One Essex Street | Marblehead, MA 01945
m 617.834.8205
www.OliverReports.com
www.TeamHarborside.com
Andrew.Oliver@SothebysRealty.com
Sotheby’s International Realty® is a registered trademark licensed to Sotheby’s International Realty Affiliates LLC. Each Office Is Independently Owned and Operated
Housing Inventory drops even further: a breakdown by price
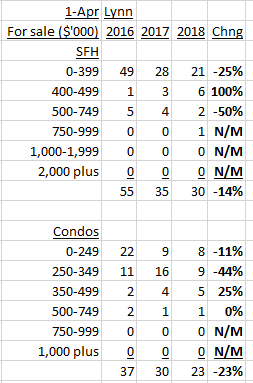
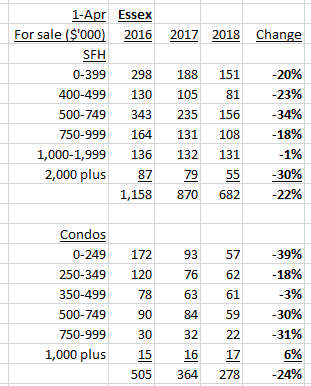
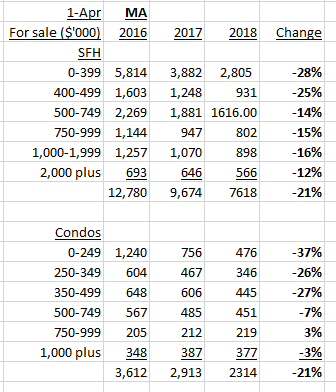
This will come as no surprise to anybody who has been looking for a home to buy, but the number of both Single Family Homes (SFH) and Condos for sale throughout the North Shore, Essex County and Massachusetts as a whole has continued to drop, in many cases sharply, from already low levels a year ago.
First, I’ll show the percentage declines in the different market, followed by a detailed breakdown of inventory by price (note that the percentage change shown in the tables is from 2017 to 2018).
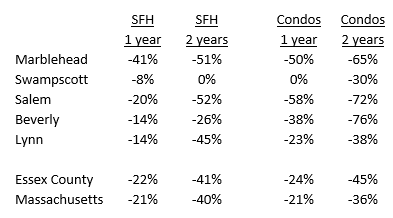
Oliver Reports, MLS
In line with the principle of shopping locally, I will start with 5 North Shore towns, followed by Essex County and Massachusetts.
Marblehead
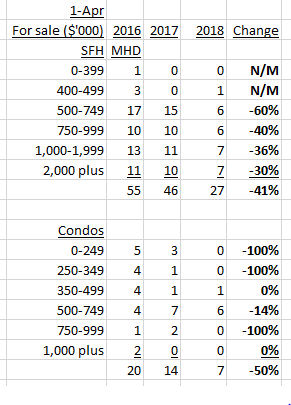
Swampscott
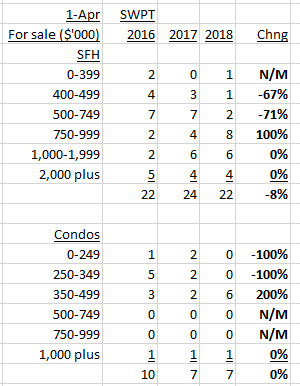
Salem
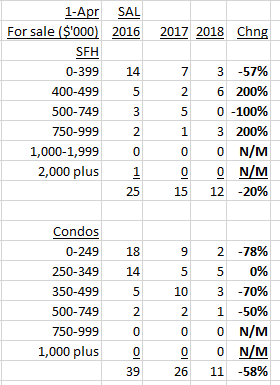
Beverly
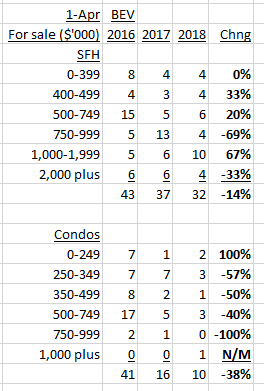
Lynn
Essex County
Massachusetts
If you – or somebody you know – are considering buying or selling a home and have questions about the market and/or current home prices, please contact Andrew Oliver on 617.834.8205 or Kathleen Murphy on 603.498.6817.
If you are looking to buy, we will contact you immediately when a house that meets your needs is available. In this market you need to have somebody looking after your interests.
Are you thinking about selling? Read Which broker should I choose to sell my house?
Andrew Oliver and Kathleen Murphy are Realtors with Sagan Harborside Sotheby’s International Realty. Each Office Is Independently Owned and Operated
@OliverReports
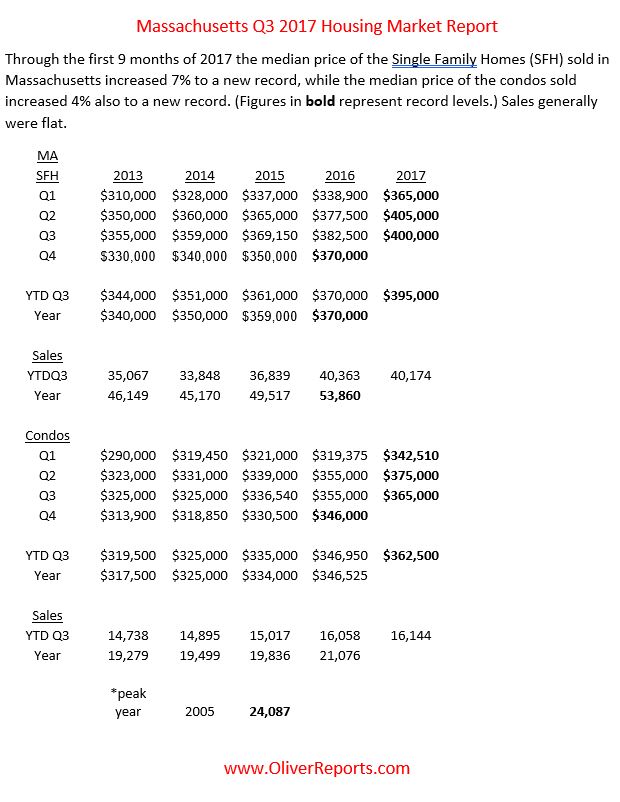
Massachusetts Q3 2017 Housing Market Report
Click here to download a pdf of this report.
If you – or somebody you know – are considering buying or selling a home and have questions about the market and/or current home prices, please contact Andrew Oliver on 617.834.8205 or Kathleen Murphy on 603.498.6817.
If you are looking to buy, we will contact you immediately when a house that meets your needs is available. In this market you need to have somebody looking after your interests.
Are you thinking about selling? Read Which broker should I choose to sell my house?
Andrew Oliver and Kathleen Murphy are Realtors with Harborside Sotheby’s International Realty. Each Office Is Independently Owned and Operated
@OliverReports
Housing Inventory really has fallen sharply
We know, in general, that housing inventory has dropped sharply in recent years. The following 4 charts show the detail: the first two for Marblehead, Swampscott, Salem, Beverly and Lynn; and the last 2 for Essex County and Massachusetts as a whole, for both SFHs and Condos.
Marblehead, Swampscott, Salem, Beverly and Lynn
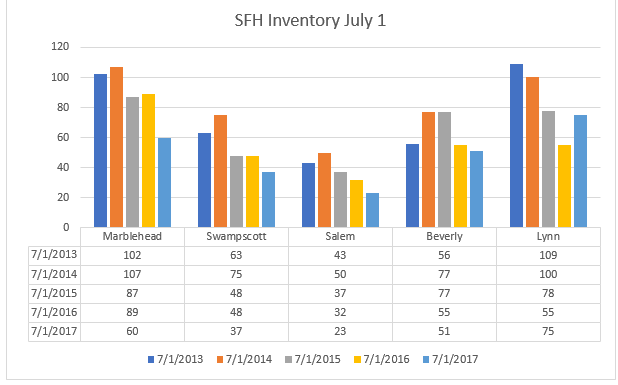 (more…)
Homes are Selling Fast across the country
- The National Association of REALTORS® surveyed their members for their monthly Confidence Index.
- The REALTORS® Confidence Index is a key indicator of housing market strength based on a monthly survey sent to over 50,000 real estate practitioners. Practitioners are asked about their expectations for home sales, prices and market conditions.
- Homes sold in 60 days or less in 36 out of 50 states, and Washington D.C.
- Homes typically went under contract in 34 days in March!
Are you thinking about selling? Read Which broker should I choose to sell my house?
If you are looking to buy, I will contact you immediately when a house that meets your needs is available. In this market you need to have somebody looking after your interests.
Please contact me on 617.834.8205 or Andrew.Oliver@SothebysRealty.com for a free market analysis and explanation of the outstanding marketing program I offer
Andrew Oliver is a Realtor with Harborside Sotheby’s International Realty. Each Office Is Independently Owned and Operated
@OliverReports
What this week’s storm told us about housing prices in 2017
During Tuesday’s storm a tree came down on the roof of my house (fortunately the fall was cushioned and there was no damage to the house), but on Wednesday I wanted the tree removed before any further excitement. I contacted tree removal companies – and guess what? Yep, they were inundated with calls. So what happened to their prices do you think? Right again – they sky-rocketed, like Uber surge pricing on New Year’s Eve.
Both the tree removal and Uber pricing are examples of a simple economic law: that of supply and demand. In both cases, demand far exceeded supply and when that happens economic theory suggests prices rise. And they sure did on Wednesday!
Trees and real estate prices
What does this mean for real estate prices in 2017?
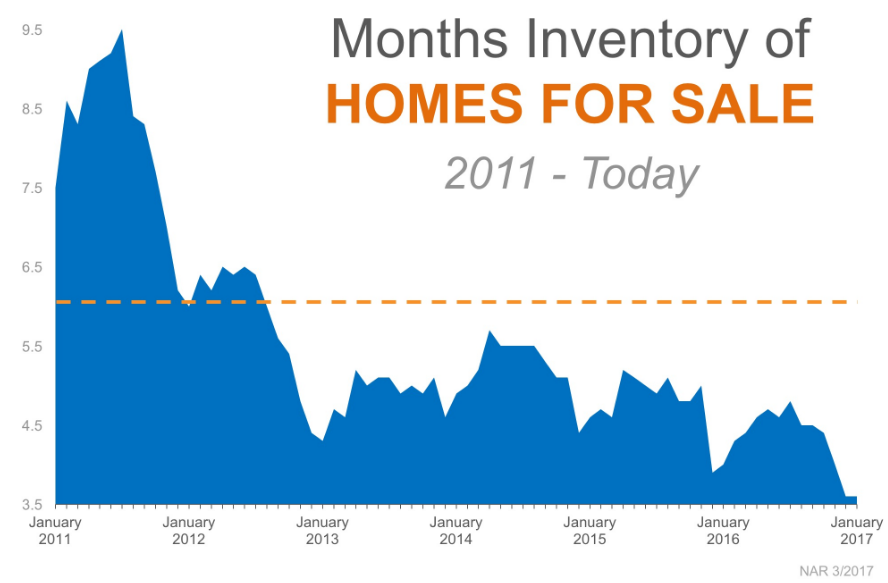
Well look at this chart, produced by the National Association of Realtors (NAR). Inventory has dropped year over year for 20 months in a row
A mismatch between supply and demand can occur either through too much demand or too little supply – think of how OPEC used to keep oil prices high by reducing production – i.e. reducing supply.
Now look at the chart above. The dotted line represents 6 months of supply – the level at which house prices are regarded as being in equilibrium between buyers and sellers. If there is more than 6 months of supply, equilibrium swings in favor of buyers who they have plenty of choices and so can determine prices. But when, as for the last few years, supply is less than 6 months, equilibrium swings in favor of sellers. So what happens to prices? They go up.
Nationally, according to the Federal Housing Finance Agency, home prices in the last 5 years have increased by 5%, 7%, 5%, 6% and 6% – pretty consistent and steady gains.
Should I wait for a better time to buy?
I don’t think the issue is one of timing as much as finding the right house, as I expect house prices to continue to rise (supply and demand) while mortgage rates are also likely to head higher as the year progresses.
A lot of buyers are hoping that there will be new inventory come the spring. That should indeed happen and when it does there is likely to be a lot of competition, which is why it is important for buyers to put themselves in the best position to be able to buy. And that means using a buyer agent to work on your behalf.
If you are looking to buy, I will contact you immediately when a house that meets your needs is available. In this market you need to have somebody looking after your interests
If you are planning to sell read Which broker should I choose to sell my house?
Please contact me on 617.834.8205 or Andrew.Oliver@SothebysRealty.com for a free market analysis and explanation of the outstanding marketing program I offer
Andrew Oliver is a Realtor with Harborside Sotheby’s International Realty. Each Office Is Independently Owned and Operated
@OliverReports
How much does Boston impact Massachusetts condo prices?
Boston has a huge impact on the Massachusetts condo market and this article quantifies that impact: Boston added over $50,000, or 15%, to the median price of a condo in Massachusetts in 2016. (more…)
Massachusetts 2016 housing market By The Numbers
The median price of a Single Family Home (SFH) in Massachusetts in 2016 rose 3% to a new high, finally passing the prior 2005 peak. The median price of a condo rose 3.5% to a new high. Sales of SFHS were a record while condo sales remain 13% below 2005 levels. The impact of Boston on MA condo prices is explored in How much does Boston impact Massachusetts condo prices?. (more…)
Housing Inventory continues to decline
The number of Single Family Homes (SFH) for sale at the beginning of December in both Essex County and Massachusetts has fallen by nearly a quarter over the last two years, with most of that decline coming in the last year, as shown in the charts below: (more…)
Huge jump in Mortgage Loan Limits
Home buyers in Essex County and Suffolk County received a major boost this week with the announcement that the limit for conforming mortgages was being increased by 18% from $523,250 to $598,000.
For a buyer putting down 20% the price of a home that can be financed conventionally – meaning that it can be sold to Fannie Mae or Freddie Mac – jumps by almost $100,000, from $654,063 to $747,500.
This table shows the trend in the last few years: (more…)



Recent Comments