
Boxford 2017 Housing Market Review
(Click here to download a copy of this report.)
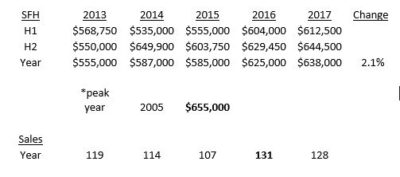
The median price of the SFHs sold in Boxford in 2017 rose 2.1% to $638,000, still below the $655,000 recorded in both 2004 and 2005. Sales were only slightly down from 2016’s record total.
OliverReports.com
Andrew Oliver
www.OliverReports.com
andrew.oliver@sothebysrealty.com
617.834.8205
Beverly 2017 Housing Market Review
(Click here to download a copy of this report).
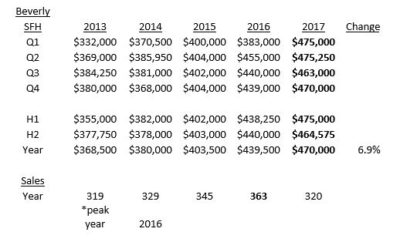
The price of the SFHs sold in Beverly in 2017 rose 6.9% to a new high of $470,000, taking the two-year gain to 16.5%. As with many markets, sales were down, reflecting the shortage of inventory.
OliverReports.com
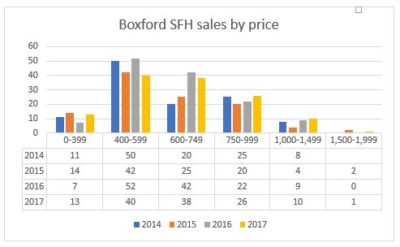
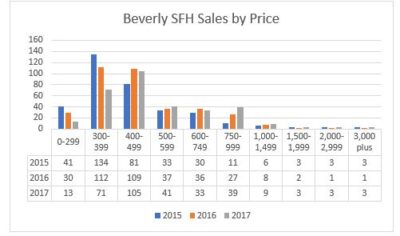
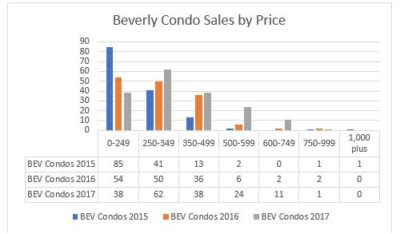
The impact of rising prices can be seen in the huge drop in sales under $400,000 and increases above that price.
Condos
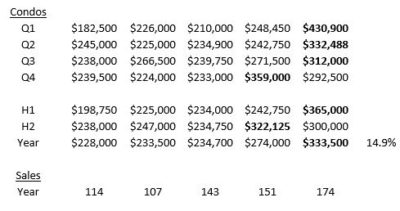
The median price of the condos sold in Beverly in 2017 increased nearly 15%, breaking through $300,000 for the first time. The biggest factor was that in late 2016 and the first 9 months of 2017 there were some 65 sales in MLS at Elliott Landing at a median price of just over $500,000.
Andrew Oliver
www.OliverReports.com
andrew.oliver@sothebysrealty.com
617.834.8205
Facebook vs Salem Old Town Hall
Facebook is up to its tricks again, choosing to display my home page photo rather than the rather nice one I selected of Salem Old Town Hall at night.
So here it is inside the actual blog post.

My preview says that Facebook will show this image. Let’s find out.
Salem 2017 Housing Market Review
(Click here to download a copy of this report
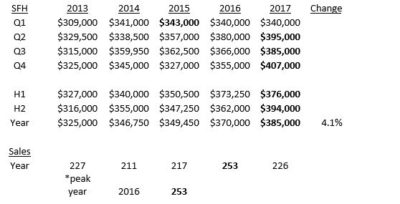
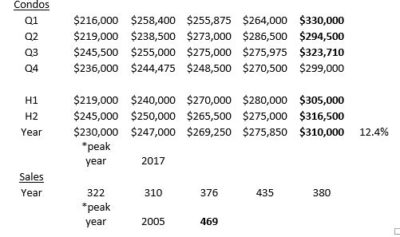
The median price of the SFHs sold in Salem in 2017 increased 4.1% to a new high of $385,000. Sales were down somewhat from 2016, reflecting the shortage of inventory. (Numbers in bold represent peak levels).
OliverReports.com
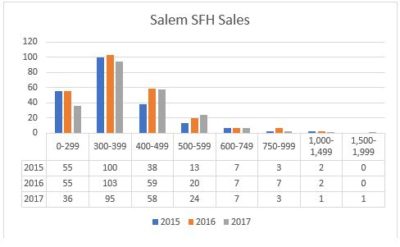
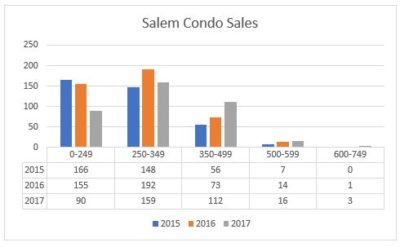
The breakdown of sales by price shows a drop in sales under $400,000, a reflection of gently rising prices.
OliverReports.com
Condos
The median price of the condos sold in Salem in 2017 rose 12.4% to a record $310,000, breaking through $300,000 for the first time. Shortage of inventory caused a sharp drop in sales.
OliverReports.com
Andrew Oliver
www.OliverReports.com
andrew.oliver@sothebysrealty.com
617.834.8205
Open Houses Sunday January 28
A mild, snow-free day to visit these Open Houses:
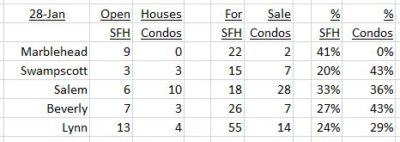
Harborside Sotheby’s International Realty
Marblehead Open Houses
Swampscott Open Houses
Salem Open Houses
Beverly Open Houses
Lynn Open Houses
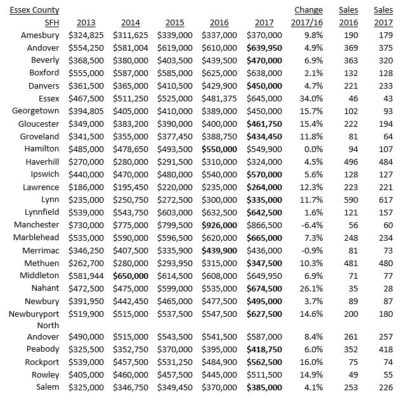
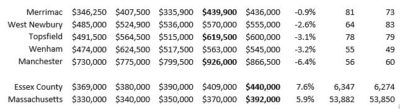
Town by Town 2017 Median Prices in Essex County
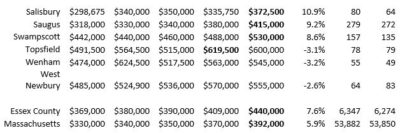
The median price of the 6,000 plus Single Family Homes (SFH) sold in the 34 cities and towns of Essex County in 2017 increased by $31,000, or 7.6%, to a new record $440,000 compared with 2016. While the overall market reached a new high, in 14 of the towns the median price is still below the prior peak level.
This report lists the prices in four ways: alphabetically by town; by price highest to lowest; by the increase in 2017 over 2016; and by the increase in 2017 compared with 2013.
I also show sales for the last two years, because the greater the number of sales the more reliable the median price as a gauge of the market. Record price levels are shown in bold. If no figure in bold is shown in the table that means that the peak for that town was achieved in the 2005/06 period.
Median price alphabetically (click here to download a pdf of this table).
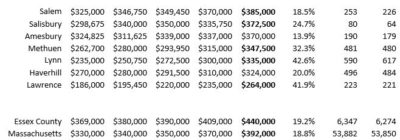
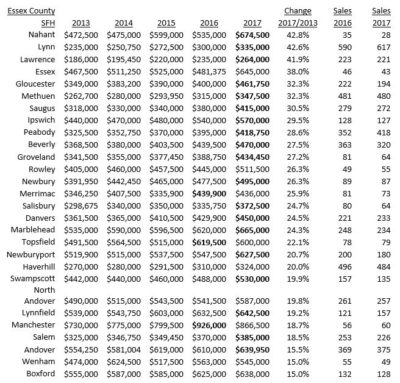
Median price highest to lowest (click here to download a pdf of this table)
The calculation for the median price for Essex County considers all 6,000 plus sales in one bucket and produces a median price of $440,000. But if one looks at the sales by town, the median price jumps to $520,750. The reason for this difference is that several of the towns with the highest number of sales have the lowest median prices.
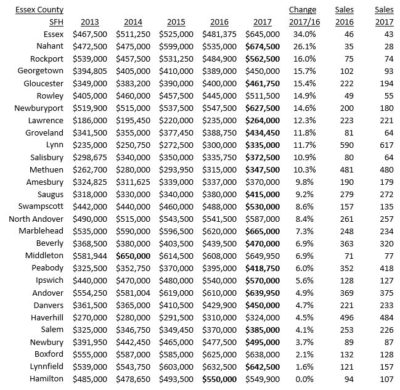
2017 compared with 2016 (Click here to download a pdf pf this table)
12 towns saw a double digit increases in 2017, although the largest increases occurred in markets with a small number of sales.
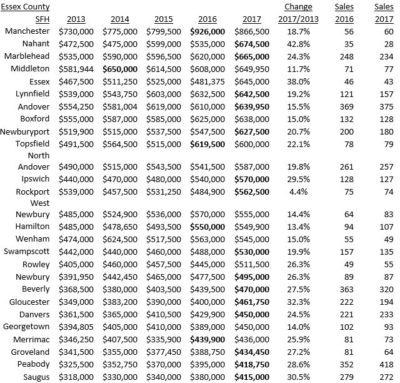
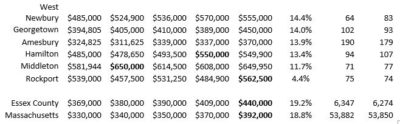
2017 compared with 2013(click here to download a pdf of this table)
The median price in Essex County has increased by 19.2% since 2013, with 14 towns showing gains of more than 25%.
Comment
2017 was a strong year for property prices in Essex County. As always, there were variations from town to town, but overall demand exceeded supply and supply was generally very low, except at the higher end of the price range.
2018 starts with uncertainty over the impact of the tax changes as far as the limitation on the ability to deduct State and property taxes. This, however, will not impact the lower price levels, where a growing economy and rising demand will once again run into a shortage of supply.
At the higher end, where supply remains adequate, lower personal and corporate taxes and a booming stock market should give buyers the wherewithal to step up and take advantage of attractive prices.
If you – or somebody you know – are considering buying or selling a home and have questions about the market and/or current home prices, please contact Andrew Oliver on 617.834.8205 or Kathleen Murphy on 603.498.6817.
If you are looking to buy, we will contact you immediately when a house that meets your needs is available. In this market you need to have somebody looking after your interests.
Are you thinking about selling? Read Which broker should I choose to sell my house?
Andrew Oliver and Kathleen Murphy are Realtors with Harborside Sotheby’s International Realty. Each Office Is Independently Owned and Operated
@OliverReports
New Listings week of January 26
A very quiet week for new listings:
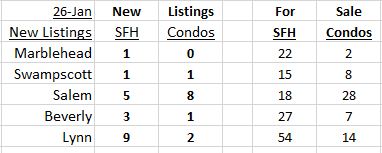
Harborside Sotheby’s International Realty
Marblehead new listings
Swampscott new listings
Salem new listings
Beverly new listings
Lynn new listings
New Listings mid-week January 24
A very quiet week so far for new listings:

Harborside Sotheby’s International Realty
Marblehead new listing
Swampscott new listing
Salem new listings
Beverly new listings
Lynn new listings
Swampscott market surges to new high in 2017
(Click here to download a pdf of this report.)
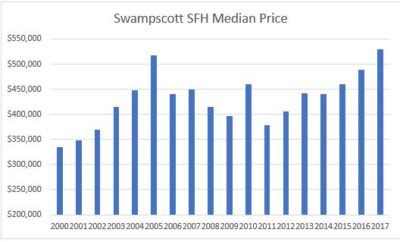
The median price of the Single Family Homes (SFH) sold in Swampscott in 2017 jumped $42,000, or 8.6%, to a new high of $530,000, finally surpassing the prior 2005 peak of $517,300. Sales, however, reflecting the low inventory all year, dropped to 135 from 157 in 2016 and 183 in 2015.
Median price
The first chart shows median prices since 2000. I find it helpful to look at longer term trends and this chart shows how prices – which had already risen for some years prior to 2000 – jumped sharply in the early years of the millennium, with a spike in 2005, and dropped during the Great Recession. Prices have been moving upwards for the last three years.
Source:Oliver Reports
Open Houses before the Patriots play
A mild day lies ahead to visit these Open Houses before the main event of the day at 3:05.

Harborside Sotheby’s International Realty
Marblehead Open Houses
Swampscott Open Houses
Salem Open Houses
Beverly Open Houses
Lynn Open Houses
GO PATS!!!
New Listings week of January 19
A small number of new listings this week:

Source: Harborside Sotheby’s International Realty
Marblehead new listings
Salem new listings
Beverly new listings
Lynn new listings
New Listings mid-week
Here are the new listings immediately after the Martin Luther King holiday: (more…)
Open Houses Sunday January 14
The snow has gone and it will be sunny for today’s Open Houses: (more…)
Marblehead: 2017 Housing Market sets another record
(Click here to download a pdf of this report.)
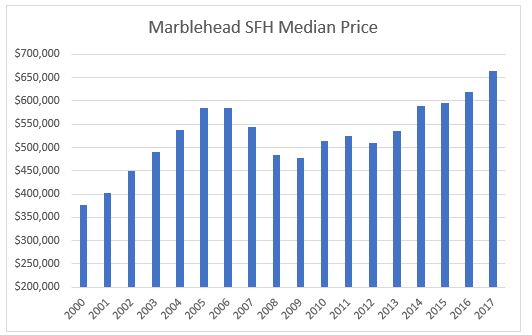
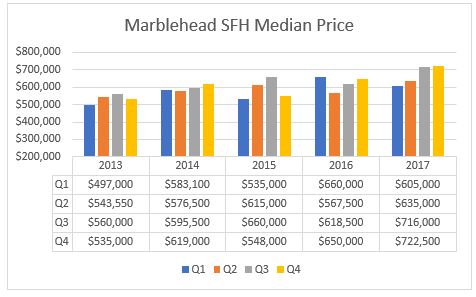
In 2017 the median price of the Single Family Homes (SFH) sold in Marblehead increased by $45,000, or 7%, to $665,000, a new record high for the fourth year in a row. As in every year since 2000 except 2010 and 2011, the median price was higher in the second half of the year than in the first half, breaching $700,000 for the first time.
Sales were down only modestly, despite the low inventory all year, while the number of SFHs for sale on average dropped about 25% from the levels of the two prior years, and by 45% compared with 2014.
It is important to bear in mind that only around 4% of Marblehead’s more than 6,200 SFHs change hands publicly in any year, but 4% is a reasonable sample, with sales taking place from $290,000 to $5.8 million.
Median price
The first chart shows median prices since 2000. I find it helpful to look at longer term trends and this chart shows how prices – which had already risen for some years prior to 2000 – jumped sharply in the early years of the millennium, dropped during the Great Recession, recovered, and have now hit new highs for the last 4 years. Below the chart is a table of prices since 2000.
Source: MLS, Oliver Reports
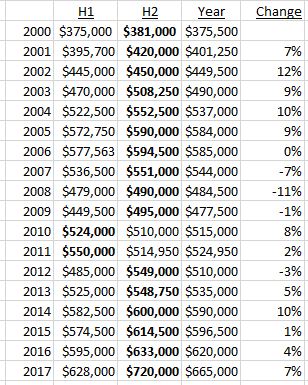
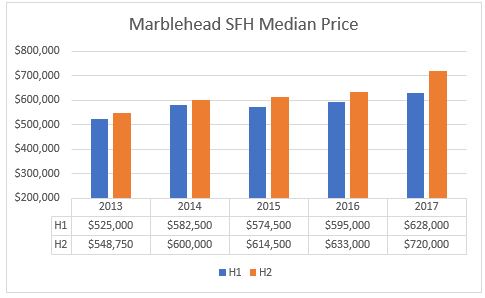
The second chart shows the median price for the two halves of the year and for the full year for the last 5 years. The second half of 2017 saw a significant upward movement.
The next chart shows how the market can vary from quarter to quarter. In the last 5 years the highest quarterly median price has been recorded once in Q1 and twice each in Q3 and Q4.
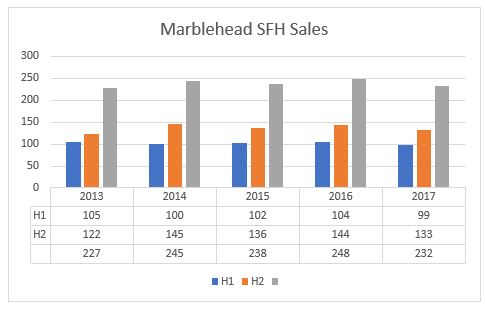
 Sales
Sales
Despite all the (accurate) stories of the lack of inventory throughout 2017 sales were down quite modestly and have been more or less flat for the last 5 years, recovering from the slump of the Great Recession, but still not back to the levels of the peak years. There is no doubt that lack of supply has been holding back sales.
Sales by price
The table shows the breakdown in sales by price for the last four years.
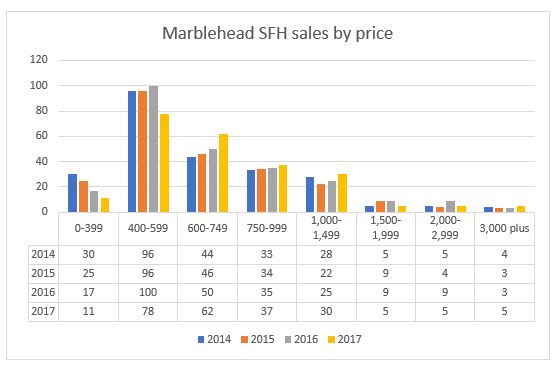 Within basically flat total sales there have been major shifts. 2017 saw a sharp drop in sales in the $4-600,000 range, while sales increased in all brackets from $600,000-$1.5 million. 2017 also saw 2 sales at $5.8 million, the highest ever recorded in MLS.
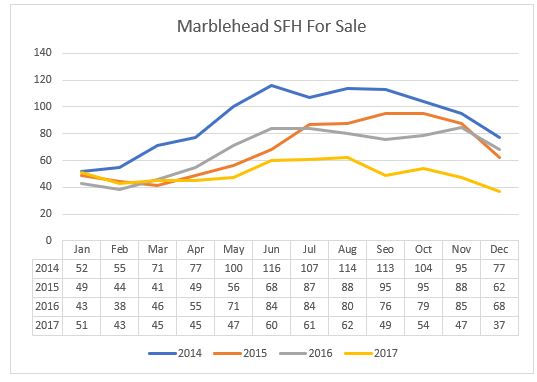
Houses For Sale
The seasonality of the number of houses for sale largely disappeared in 2017 – the traditional spring pick-up in inventory failed to materialize. The fact that total sales were down only slightly despite the low inventory implies that houses were generally selling more quickly than in prior years.
We start 2018 with just 24 SFHs for sale and 15 of those are above $1 million. The cheapest SFH listed is $519,000 and there are just 3 under $700,000.
Assessed Value to Sales Ratio (ASR)
One way I measure prices is by the ratio (ASR) of Assessed Value (AV) to Sales Price (SP). The ASR is the AV divided by the SP: if the SP is rising (prices going up), the ASR will fall. In a period of rising prices the ASR is likely, as a lagging indicator, to be below 100%.
As we hope out properties are worth more than the AV an ASR below 100% is a positive sign. Remember that AVs are a lagging indicator: the tax bills that have just been sent out for FY2018 are based on actual sales in 2016. Thus the 2017 sales data, reported in this review, will be the basis for FY2019 assessments. And my data compares 2017 sales with AVs based upon 2016 prices.
Let’s look at the ASR in recent years:
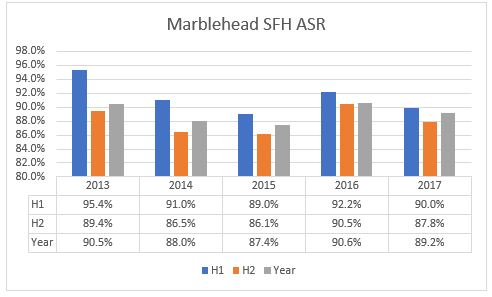
Source: MLS, Oliver Reports
For the last 4 years the ASR has been around 90% or below, indicating that the median sale has been taken place at about a 10% premium to Assessed Value, despite the increases in Assessed Values.
Outlook for 2018
Immediately after the 2016 Election I published What does the Election mean for real estate markets? in which I made the bullish case: “The removal of a lot of strangling regulations and the end of gridlock in Congress will produce stronger economic growth. Major infrastructure spending will boost jobs and wages at the lower end, while lower corporate tax rates and lower personal tax rates will produce increased personal wealth. Interest rates will rise, reflecting the stronger economy, and the demand for housing will increase. Greater wealth and confidence will provide a boost to the higher end of the market.” I concluded:”I have no doubt that 2017 will provide many surprises along the way, but with a stronger economy and low supply of houses for sale, there seems little reason for home prices in Marblehead not to continue their steady, but modest, upward movement.”
Um, well we got many surprises…..and some of the economic progress, and prices increased perhaps more than modestly. As for 2018? There are a lot of variables, particularly as people in States like Massachusetts try to figure out how they come out with the tax changes. The economy may well grow at a faster rate than in recent years, which would place upward pressure on interest rates and mortgage rates, while it is hard to see at this stage what will increase the supply of houses for sale.
Andrew Oliver
www.OliverReports.com
New Listings week ending January 12
Here are the new listings for the first full week of 2018:

Source: Harborside Sotheby’s International Realty
Marblehead new listing
Swampscott new listings
Salem new listings
Beverly new listings
Lynn new listings
Recent Comments