
Essex County Q1 2024 Market Summary
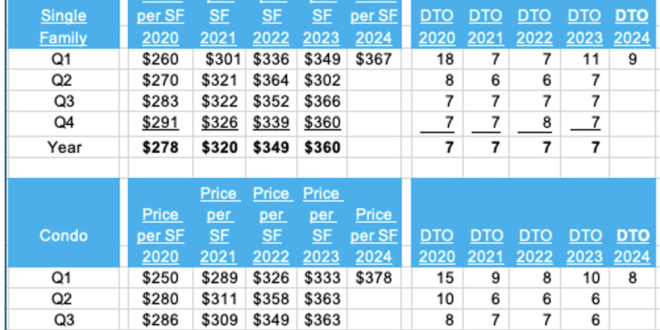
The median price of the SFHs sold in the 34 cities and towns in Essex County in Q1 was well ahead of last year’s Q1- but lower than those for the other 3 Quarters of 2023. Sales were steady, but Q1 is usually the lowest of the year and, therefore, the median price is not necessarily an indicator of where median prices will end for the whole year.
The median price of the Condos sold showed a similar pattern, while sales dropped further.
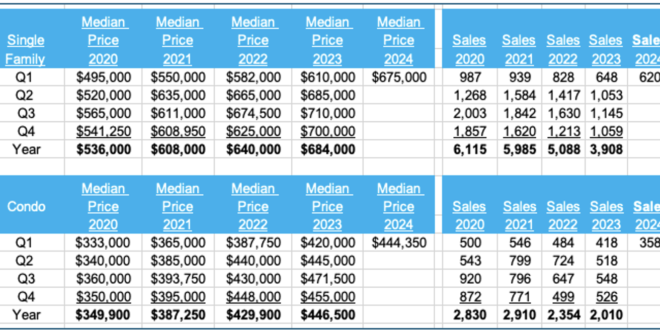
The median Price per Sq.Ft. can fluctuate Quarter to Quarter. Sales continued at a brisk pace, reflecting both the shortage of supply and the continuing demand.
(DTO- Days To Offer – the number of before an accepted offer is received.)
Please contact me for a market report for your property.
617.834.8205
Andrew.Oliver @Compass.com
OliverReportsMA.com
Licensed with Stuart St. James in Massachusetts
Licensed with Compass in Florida
SALEM 2023 MARKET REPORT and 5-YEAR REVIEW
The many attractions of Salem continue to attract buyers, especially younger buyers moving out of Boston. Perhaps surprisingly in a time when mortgage rates have more than doubled, sales have continued to be brisk, and in every month in 2023 from April onwards more than 50% of sales have taken place over list price.
Fluctuations in median prices can and do occur from quarter to quarter, based upon those properties which actually sell in any quarter, which is why the trend is more important than the exact numbers.
If you are thinking of selling, please contact me for a current market analysis for your property.
Go HERE to download a pdf of this report and HERE to download my Essex County report.
Median Price and Sales
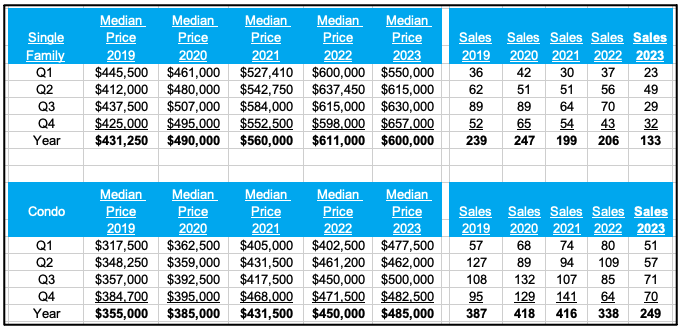
The median price of the Single Family homes sold in Salem increased 39% from $431,250 in 2019 to $600,000 in 2023, a slight decrease from $611,000 in 2022. Sales dropped slightly from 2019 to 2022, but fell sharply in 2023.
The median price of the Condos sold increased by 37% from $355,000 in 2019 to $485,000 in 2023. Sales started to fall in the second half of 2022 and were also down sharply in 2023.
Single Family Sales by Price
Another way to look at sales is the distribution by price. (more…)
ESSEX COUNTY 2023 MARKET REPORT and 5-YEAR REVIEW
Go HERE to download a pdf of this report
Median Price and Sales
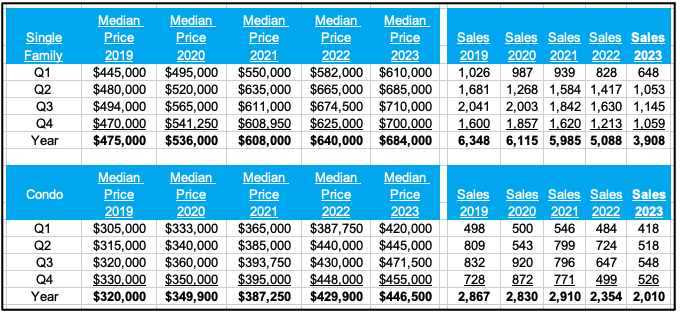
The median price of the Single Family homes (SFH) sold in Essex County increased 44% from $475,000 in 2019 to $684,000 in 2023. Sales declined slightly from 2019 to 2021, but dropped sharply in 2022, and again in 2023, when they were almost 40% lower than in 2019.
The median price of the Condos sold increased by 40% from $320,000 in 2019 to $446,500 in 2023. Sales followed a similar pattern to that for SFHs, declining 30% from 2019 to 2023.
Single Family Sales by Price
Another way to look at sales is the distribution by price. In 2019, 55% of SFH sales were under $500,000, and by 2022 that had dropped to just 16%. Conversely, the share of sales over $750,000 went from 13% to 35% in the same period. (more…)
SWAMPSCOTT 2023 MARKET REPORT and 5-YEAR REVIEW
Swampscott’s focus on controlling its expenditures and hence the property tax rate has brought increased buyer interest in recent years, with two-thirds of all sales in 2023 being at or above list price.
As elsewhere, the shortage of inventory was a major factor in both price increases and the speed of sales in 2023, despite the more than doubling of mortgage rates.
Fluctuations in median prices can and do occur from quarter to quarter, based upon those properties which actually sell, which is why the trend is more important than the exact numbers. Go HERE to download a copy of this report.
If you are thinking of selling, please contact me for a current market analysis for your property.
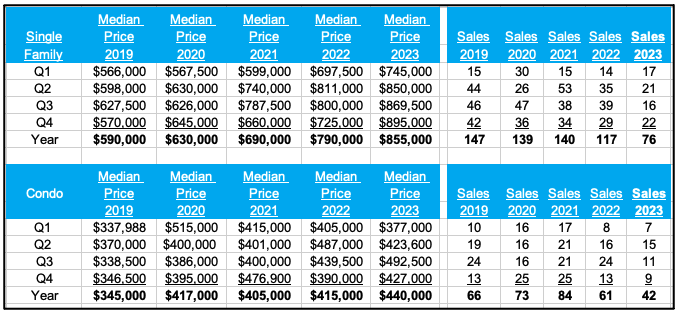
Median Price and Sales
The median price of the Single Family homes sold in Swampscott increased 45% from $590,000 in 2019 to $855,000 in 2023. Sales were steady from 2019 to 2021, but dropped in 2022, and again, sharply, in 2023.
The median price of the Condos sold increased by 28% from $345,000 in 2019 to $440,000 in 2023, with sales following a similar pattern to that for SFHs.
 (more…)
MARBLEHEAD 2023 MARKET REPORT and 5-YEAR REVIEW
Just as in prior periods of housing market strength, the market in Marblehead saw a steady – rather than spectacular – increase in prices during the boom days of asset price increases, which were fueled by cheap credit, during and after the pandemic.
The reasons are as old as the town itself: Marblehead is a great place to live and bring up children, which is why people stay in their houses longer than they do elsewhere. Add to that, WFH (Work from Home), making the commute to Boston less of an issue.
The more than doubling of mortgage rates has also been a major factor in encouraging people to stay in their existing homes, further reducing the supply of homes for sale.
Finally, fluctuations in median prices can and do occur when the numbers are small, which is why the trend is more important than the exact numbers.
If you are thinking of selling, please contact me for a current market analysis for your property. Go HERE to download a pdf of this report and HERE to downlaod my Essex County report.
Median Price and Sales
The median price of the Single Family homes sold in Marblehead increased 34% from $717,500 in 2019 to $964,875 in 2023, and by 3% from 2022 to 2023. Sales were steady from 2019 to 2021, but dropped in 2022, and again in 2023. (more…)
Essex County Q3 2023 Market Report
The median price of the Single Family homes sold in Essex County increased 35% from $475,000 in 2019 to $640,0000 in 2022, and to $680,000 through Q3 2023. Sales were quite steady from 2019 to 2021, but dropped sharply in 2022, and again YTD in 2023.
The median price of the Condos sold increased by 34% from $320,000 in 2019 to $429,900 in 2022, and to $450,000 YTD Q3 2023. with sales following a similar pattern to that for SFs.
Go HERE to read a copy of the full report
And these recent articles:
Why Mortgage Rates will fall in 2024
Most Sales Still Over List Price
Core Inflation Prices Barely Budged in August
MARBLEHEAD Q3 MARKET REPORT 2019-2023
SWAMPSCOTT Q3 MARKET REPORT 2019-2023
SALEM Q3 MARKET REPORT 2019-2023
ESSEX COUNTY Q3 2023 MARKET REPORT (more…)
October Inventory shows Sharp Jump from September
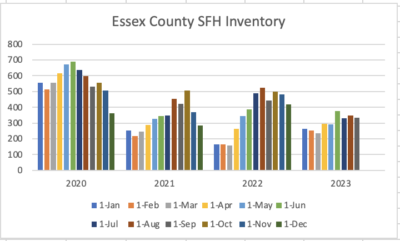
Overall Inventory in Essex County has been on a roller-coaster this year in terms of comparison with a year ago.
Single Family Homes (SFH)
In the early months SFH was up 50% or more from the extremely low levels in 2022. By the summer, YOY inventory was down by around 1/3. October showed an increase of 1/3 from September 1, bringing the YOY deficit to just 11%.
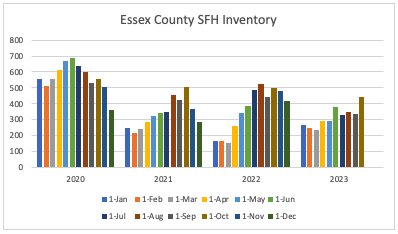
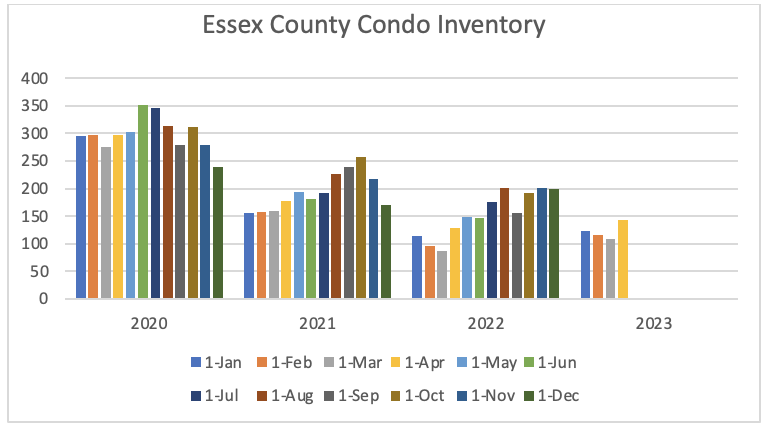
Condos
Condo inventory showed a similar, if less exaggerated, pattern. The 45% increase from September to October brought inventory levels in line with 2022’s, but still well below those in 2020 and 2021.
(more…)
No signs of improvement in Housing Inventory
Single Family Homes (SFH)
SFH inventory did not have the usual early summer bump this year and is now running 25% below last year’s level:
Condos
Condo inventory is even more depressed and is now 45% lower thn it was in 2021:
(more…)
June Sales in Swampscott mostly At or Over List Pricce
11 of 15 sales in Swampscott in June were at or above List Price:

And these recent articles:
Marblehead Mid-year 2023 Market Stats
Swampscott Mid-year 2023 Market Stats
Salem Mid-year 2023 Market Stats
Economic and mortgage commentary
Two signs Inflation is Slowing (more…)
July Inventory shows Sharp Drop
Single Family Homes (SFH)
SFH inventory dropped sharply in July from the previous month 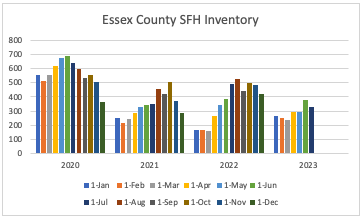
Condos
Condo inventory also dropped from June.
(more…)
June Inventory shows modest increases
Single Family Homes (SFH)
After holding steady for much of the year, SFH inventory did see a boost in June, albeit only to the levels of the last two years and still well below that in 2020:
Condos
Condo inventory saw a more modest increase and remains well below half the 2020 level:
Mortgage rates
As inflation soared well beyond the Fed’s preferred 2%, interest rates climbed in 2022, driving mortgage rates to a multi-year high.
As inflation appeared to slow in early 2023, coupled with the failure of some large banks, the yield on 10T dropped, leading to a drop in the FRM of 1% . Inflation, however, has remained stubbornly high – and the labour market stubbornly strong- causing interest rates and the FRM to move up again.
And these recent articles:
Economic and mortgage commentary
Two signs Inflation is Slowing
Lies, Damned Lies and Inflation “Statistics”
Federal Reserve increase rates; Mortgage Rates drop
What drives Mortgage rates in one chart
How Marblehead’s 2023 Property Tax Rate is Calculated
Essex County 2023 Property Tax Rates:
Town by Town guide (more…)
New Listings mid-week May 24
Just a handful of New Listings heading into Memorial Day:
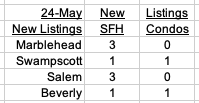
Click on these links for details:
Marblehead New Listings
Swampscott New Listings
Salem New Listings
Beverly New Listings
Here are the latest Inventory numbers: (more…)
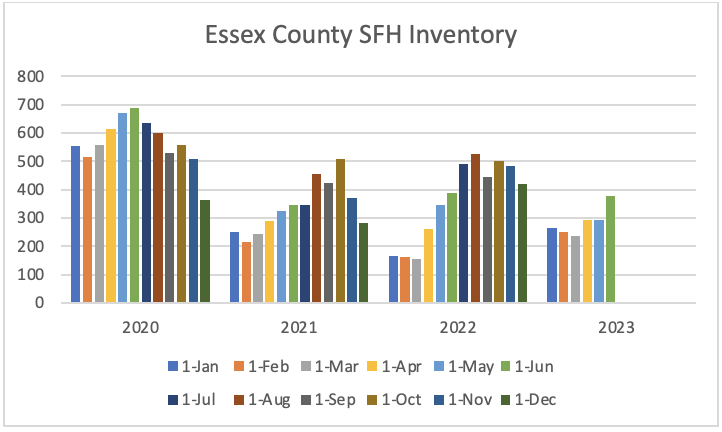
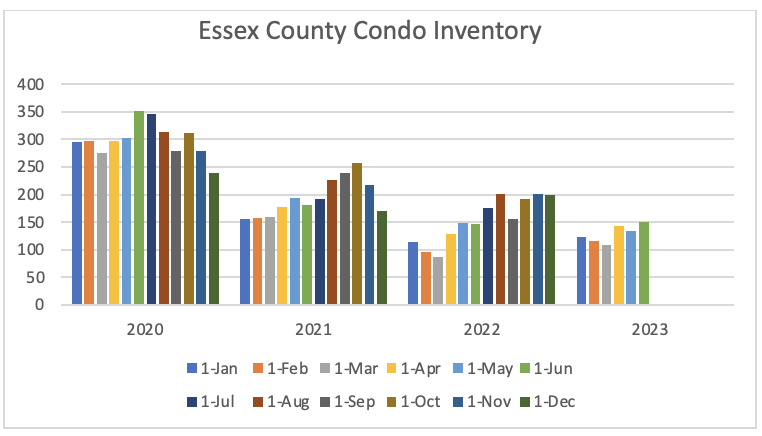
May Inventory shows no improvement
No spring boost for Inventory so far.
Single Family Homes
Condos
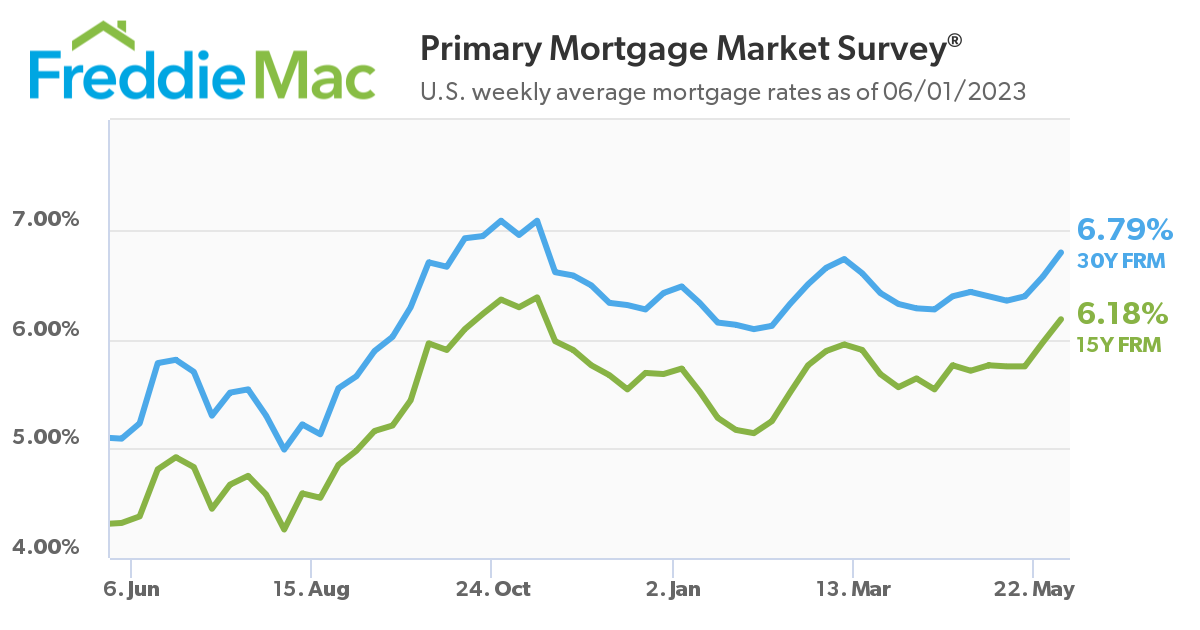
Mortgage rates
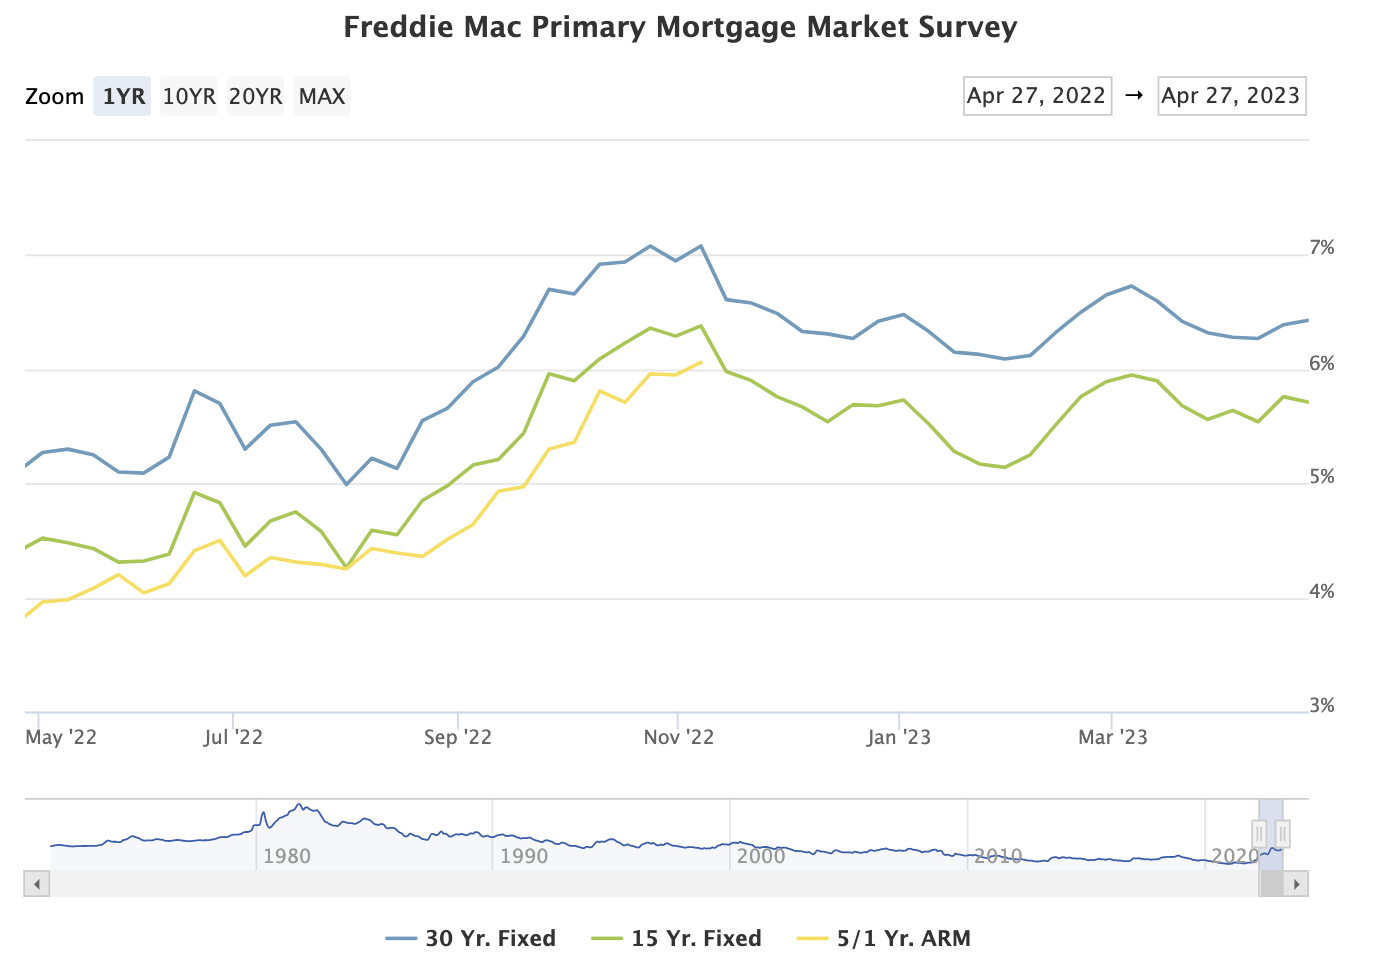
The 30-year Fixed Rate Mortgage fluctuated around 3% for most of 2021. The Fed appeared to many commentators (read my “Party on, dude” says the Federal Reserve posted in March 2021) to be taking an overly optimistic view about inflation; its indication of a policy reversal late in 2021 sparked a jump in the crucial 10-year Treasury (10T) yield and hence in mortgage rates. With inflation continuing to soar well beyond the Fed’s preferred 2%, interest rates climbed in 2022, driving mortgage rates to a multi-year high.
As inflation appeared to slow, so the yield on 10T dropped, leading to a drop in the FRM of 1% in early 2023. Inflation, however, remains stubbornly high – and the labour market stubbornly strong- causing interest rates and the FRM to move up again, before the crises at a number of banks drove Treasury yields – and hence the FRM – lower again.
In recent weeks the FRM has been mainly in the 6.25-6.5% range.
And these recent articles:
Economic and mortgage commentary
Federal Reserve increase rates; Mortgage Rates drop (more…)
Q1 2023 Market Stats
Q1 2023 Market Stats for selected towns (stats for other towns in Essex County are available on request)
Amesbury Q1
Beverly Q1
Gloucester Q1
Marblehead Q1
Salem Q1
Swampscott Q1
And these recent articles: (more…)
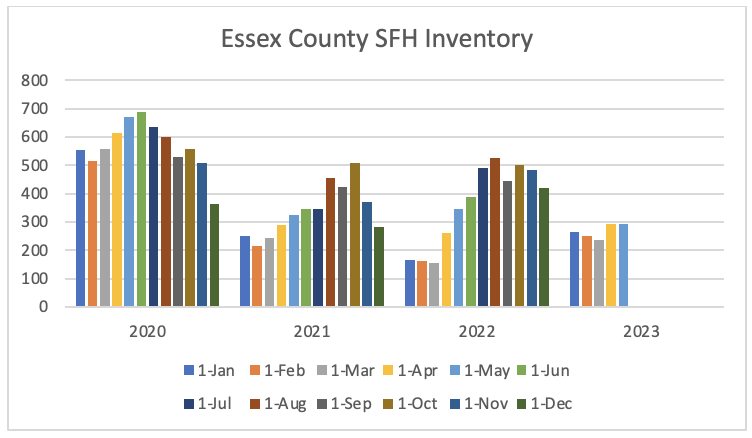
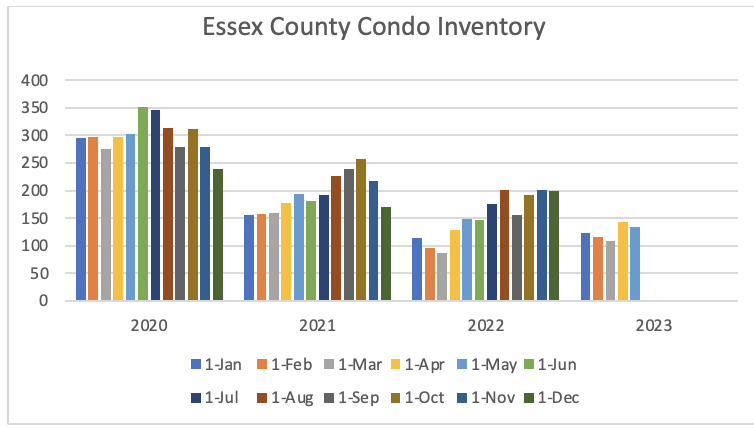
April Inventory shows little improvement
While there has been a slight uptick in inventory at the beginning of April (and spring we hope), it is less than half the 2020 levels.
Single Family Homes
Condos
Condo inventory has followed a similar pattern:
Mortgage rates (more…)
Recent Comments